Download
1 / 42
420 likes | 586 Views
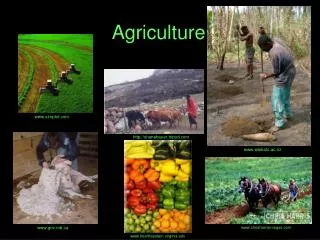
8. WHAT MACROECONOMIC ACTIVITIES ARE POLICY ISSUES FOR U.S. AGRICULTURE?. Larry D. Sanders Fall 2005. Dept. of Ag Economics Oklahoma State University. INTRODUCTION. Purpose: to understand macroeconomic policy issues & options Learning Objectives:

E N D
8. WHAT MACROECONOMIC ACTIVITIES ARE POLICY ISSUES FOR U.S. AGRICULTURE? Larry D. Sanders Fall 2005 Dept. of Ag Economics Oklahoma State University
INTRODUCTION • Purpose: • to understand macroeconomic policy issues & options • Learning Objectives: 1. Become aware of macroeconomic policy issues. 2. Understand key macroeconomic issues, options & consequences. 3. Become aware of current macroeconomic environment & outlook.
MACROECONOMIC POLICY:HISTORICAL REVIEW • 1930s • Keynes: More govt. is a solution to counter severe market failures • FDR: New Deal • 1940s • WWII: Helped end Depression; proved Keynes right • Employment Act of 1946 • 1960s • Galbraith: welfare state—technocracy controls thru big business & big govt. • Current • Neo-Conservative view: less social govt. & more free market • Growing Populist view: big business needs to be reigned in by govt.
MACROECONOMIC GOALS • HIGH EMPLOYMENT--Prevent Depression, Unemployment, Recession • PRICE STABILITY--Keep inflation down • EFFICIENCY--Micro & Macro • EQUITABLE DISTRIBUTION OF INCOME--Equity, Re-distribution, Fight poverty • GROWTH--Increase quantity & quality • FREE MARKET • ECONOMIC SECURITY • CUT TAXES
MACROECONOMIC POLICY AGENTS • Fiscal Policy (changes in federal spending; changes in taxation) • President • Congress • Monetary Policy • Federal Reserve System • Change money supply with changes in interest rates
MACROECONOMIC POLICY LOOSE TIGHT MONETARY Increase M Cut/Steady M (changes (reduce i): (increase i): in interest Inflation Cuts inflation rates) or leads to deflation FISCAL Increase G Cut/Steady G (changes (increase (decrease in govt spending or spending or spending cut taxes): increase taxes): or taxes) Inflation Cuts inflation or leads to Stagflation
Macro Policy: Alternatives & Consequences • Loose Fiscal & Monetary Policy (Pre-Carter; Reaganonomics; Bush2-nomics?) • Increasing: interest rates, domestic investment, crowding out, employment, debt costs • Decline in inflow of foreign capital & value of $, increased exports, reduced imports, hi exchange rate stress, hyperinflation, overvalued farm assets • Stabilization policy likely results • Loose Monetary & Tight Fiscal Policy (Carternomics) • Increasing interest rates, decline in foreign capital, weakened $, improving trade deficit • Increasing inflation, cashflow & cost price stress, stagflation (?), decline in off-farm employment
Macro Policy:Alternatives & Consequences (cont) • Loose Fiscal & Tight Monetary Policy (Reaganomics, Bush2-nomics 2d Term?) • Hi real interest rates, lo investment, hi debt cost, inflow of foreign capital, lower living standard, budget deficit • Strong $, trade deficit worsens, protectionism, lower inflation, decreased farm income/ financial crisis, cost-price squeeze, devalued farm assets • Tight Fiscal & Monetary Policy • Hi interest rates, strong $, trade deficit worsens • Reduced economic activity, decline in inflation, recession (?), decline in off-farm employment, depression (?), decline in loan access, decline in technology adoption
Macro Policy:Alternatives & Consequences (cont) • Moderate Fiscal & Monetary Policy (Clintonomics) • Moderate real interest rates, increased investment, lo unemployment, lower growth in debt costs • Lo inflow of foreign capital, moderate value of $, trade deficit improves, decline in protectionism, moderate inflation • Increase in technology transfer, national income • Decline in farms, increase in farm size, increase in off-farm income • Uncertainty with global economy & structural change
Macro Policy:Alternatives & Consequences (cont) • Bush2-nomics?* • Actions/impacts: • Tax cuts • Rapidly increasing budget deficit • Large job loss, slight recovery; unemployment relatively high • Very low interest rates (first term Fed response to low inflation) • Trade deficit rising • Global economy mixed • Appears to be a “borrow and spend” politician • Rising interest rates (2d term Fed response to inflation) *Also, see slides at end of this presentation
Macroeconomic Situation: US (1993-1997) 1993 1994 1995 1996 1997 GDP($b.) 6568 6955 7401 7638 8305 PerCap DispInc(92$) 18078 18431 18861 19116 19493 (96$) 21838 Unemp (%) 7.4 6.8 5.6 5.4 4.9 LEI (92) 98.8 101.4 100.8 102 103.9 Bud bal($b.) -330 -225 -177 -151 -50 Trade bal($b.) -136 -175 -191 -235 -242 AgTrade($b.) 18 19 26 27 21 (net) Hld inc(avg$) 41428 43133 44938 47123 49692 Farm hld inc (% of US) 97 99 99 107 106 Farm % 12 10 11 16 12
Macroeconomic Situation: US (1998-2002) 1998 1999 2000 2001 2002 GDP($b.) 8782 9297 9825 10082 10469 PerCap DispInc(92$) 19963 (96$) 22800 22671 23471 23602 24300 Unemp (%) 4.7 4.2 4.0 4.7 5.8 LEI (96) 108.8 109.9 109.5 111 Bud bal($b.) 70 124 232 268 -157.8 Trade bal($b.) -259 -340 -473 -462 -493 AgTrade($b.) 17 12 11.8 13.7 12.3 (net) Hld inc(avg$)51855 54842 57045 58208 57852 Farm hld inc (% of US) 115 117.3 108.6 110.2 113.7 Farm % 12 9.9 4.2 8.6 5.3
Macroeconomic Situation: US (2003+)(Current as of 2005) 2003 2004 2005 2006 2007 GDP($b.) 10971 11734 12400 PerCap DispInc(00$) 28065 29475 30,400 Unemp (%) 6.0 5.5 5.2 5.1 LEI (96) 113 116 138 Bud bal($b.) -374 -413 -331 -314 -324 Trade bal($b.) -527 -686 -720 AgTrade(net$b.) 10.5 9.7 4.5 Hhld inc(avg$) 59067 60528 Farm hld inc 116 (% of US) Farm Inc 11.2 16.3 13.7 (% farm hhld income)
Macroeconomic Situation: World Economic Growth (1993-97; Annual % change in real GDP) Economy1993 1994 1995 1996 1997 World (%) 1.5 3.0 2.8 3.5 3.4 Less US (%) 1.1 2.7 2.8 3.4 3.0 Developed less US 0.1 2.1 2.1 2.8 2.3 Transition 6.3 8.1 -1.3 -0.8 1.4 Developing Asia 8 8.8 8.3 7.4 5.8 Latin Am. 4.3 5.3 1.4 3.7 5.2 Mideast 3.4 -0.3 4.4 4.7 4.4 Africa 1 3.2 2.9 5.2 2.8
Macroeconomic Situation: World Economic Growth (1998-2004; Annual % change in real GDP) Economy 1998 1999 2000 2001 2002 2003 2004 05 World (%) 2.2 3.1 4.0 1.5 1.7 2.6 3.8 3.1 Less US (%) 1.4 2.5 4.2 1.8 1.7 2.5 3.6 2.8 US 4.3 4.1 3.8 0.2 2.4 2.4 3.6 Developed less US 1.6 2.1 3.5 1.4 1.0 1.6 2.3 1.6 Transition -1.4 4.5 7.1 5.1 3.9 6.1 6.6 4.7 Developing Asia 0.2 6.6 7.1 3.8 5.7 6.1 7.2 6.4 Latin Am. 2.0 0 3.7 0.3 -0.9 1.6 5.8 Mideast 3.9 -0.9 5.7 -1.4 3.2 2.7 7.4 5.6 Africa 3.1 3.1 3.6 3.4 3.3 4.1 4.1 4.8
World Economic Growth, 1993-2006(annual % change in real GDP)
World Economic Growth, 1993-2006 (annual % change in real GDP)
Federal Funds Rate July 1990-Nov 2005 4.00% (highest since May 01) Note: Discount Rate is typically ½ % lower than Fed Funds Rate Fed Funds Rate: rate charged by Reserve Bank for borrowing immediately available funds, primarily for 1 day; Discount Rate: rate charged for credit to depository institutions, including 90-day commercial paper
Another Trend: Increasing Foreign Ownership of US Debt • Early 1990s: 20% • Mid-90s: 35% • Current (2005): 52% (share & actual $ highest ever • Major holders • Foreign banks • Japan • China
SUMMARY • Economic goals change over time • Stresses importance of risk management & strategic planning • Macroeconomic policy matters to agriculture • Success in the 1990s resulted from • Federal Reserve decisions • Clinton-GOP Congress decisions • World economy improving • State & private response to macroeconomic environment • Trade agreements
SUMMARY--Recent US Economic Status • Clinton years(1993-2000) • Longest sustained economic growth in US history • Highest job creation in US history • First balanced federal budget in decades • Mixed/cyclical for agriculture
SUMMARY--Recent US Economic Status • GW Bush 1st Term [2001-03 Recession; (2001-02)-Malaise (2002-03)] • 2.5-3 million jobs lost (more than any previous President) • Projected federal budget deficits highest ever • State economies in poor shape (Service cuts? Tax break cuts? Tax increases?) • Farm economy (market) generally down(Cattle market up) • Jobless recovery economy (unemployment 6-10%) • Outsourcing of jobs increasing
Summary--Recent US EconomicStatus (continued) • Reasons for GW Bush 1st term economic slump? • Bush tax cuts • Cyclical downturns • 9/11 & “terror hangover” • Fed overly cautious in 2000 w/r/t inflation • Federal spending continues relatively high • Corporate scandals • Dissenters claim conservative agenda to create crisis to force drastic changes in federal social spending over next 10 years
SUMMARY--Economy not responding as expected • Either not responding as expected, or could be in worse shape • Fed’s loose policy of low interest rates should have spurred economic growth sooner, more broad-based • Federal spending should have spurred economic growth; slow start in 2004, finally picks up in 2005 • Federal tax cuts should have spurred economic growth sooner • The reason may be structural in nature • Economy is improving for some sectors, not for others • Economy is improving/continuing to reward those with wealth base
SUMMARY(continued) • Outlook unstable (but may be manageable at macro and micro level) • Jobless recovery turned around with more jobs, lower unemployment in 2005 • Fed interest rates on rise; not likely to stop until mid-to-late 2006 • Oil prices uncertain, but higher in short term than 2004 • Mideast strife, Wars on terrorism & Iraq • Trade agreement uncertainty • NOTE: • AS INSTABILITY IN AGRICULTURAL MARKETS INCREASES, AGRICULTURAL VULNERNABILITY TO MACROECONOMIC FORCES WILL INCREASE, LIKELY INCREASING INSTABILITY & NEED FOR MANAGEMENT SKILLS & RISK MANAGEMENT
Long Waves in Economic Activity (40-60 year cycle) TROUGH PEAK DEPRESSION 1785-90 1815 1842-49 1845 1850s (1858) 1873 1873-1879; 1895 1892-97 1914-19 (1920); 1929-39 1933 1969 (1982)* 2001? Between 2009-2029 Between 2022-2042 NOTES: (*) Decline more a recession than depression. (?) May be cyclical activity rather than long waves
“Just the facts ma’m, just the facts.”Jack Webb, Dragnet “Liars can figure but figures don’t lie.”Ronald Reagan
Additional Budget Outlook Information http://www.senate.gov/~budget/democratic/charts_econoutlook.html http://www.senate.gov/~budget/democratic/press/2001/rev_bdgtoutlook100401.pdf http://www.senate.gov/~budget/democratic/press/2002/cbofactsheet082702.pdf http://www.economicindicators.gov Also: recent federal data
Agricultural Programs in a Time of Budget Concerns The following slides (31-41) are excerpted from presentation by Craig Jagger, Chief Economist, US House Ag Committee, Sep 05, for National Public Policy Education Conference.
Budget ReconciliationSharing the Pain of Cutting Federal Spending on Mandatory Programs to Reduce the Deficit. • Budget Reconciliation: Instructions in the Congressional Budget Resolution to authorizing committees to draft changes to existing laws to achieve specified reductions in “mandatory spending.” • Mandatory Programs for Agriculture • Under the jurisdiction of the House Ag Committee • Typically multi-year programs such as under the farm bill • Food stamps, commodity program, and conservation program funding are major mandatory spending categories. • All multi-year mandatory funding is provided up front when the farm bill or other House Ag Committee bill is passed.
Budget Reconciliation & Discretionary Spending (Appropriations) • Discretionary Spending (Appropriations) for Agriculture • Under the jurisdiction of the House Appropriations Committee and the Agricultural Appropriations Subcommittee • Programs and funding are reviewed every year. • Agency salaries and expenses and research funding are major discretionary spending categories. • Funding typically is provided one year at a time in an annual appropriations bill. • The Budget Resolution specifies a maximum level for appropriations that may be lower than in prior years but cutting discretionary spending is done outside of reconciliation in regular appropriations bills.
Budget Reconciliation (Continued) • Cuts are made from baseline spending—CBO’s projections (with any Budget Committee Adjustments) of mandatory spending over the next 10 years under the assumption that current laws continue. • Only reduced spending caused by legislated changes are credited—No credit is given for lower than expected costs from changes in market conditions or USDA implementation decisions different than expected. • Cuts can come from any program under the jurisdiction of the Ag Committees: commodity, conservation, crop insurance, trade, rural development, research, foods stamps, or forestry. • The 10-year mandatory baseline for programs under the jurisdiction of the House Ag Committee is about $540 billion.
Are We Having Fun Yet? • Proposed cuts may lead to interest group wars. Every program has a constituency. • Policy changes that save money may be viewed as more attractive than they otherwise would be. • Can lead to “bad” policy if policies are designed to capture quirks in CBO baselines or estimating assumptions. • Programs with perceived problems could be viewed as likely candidates for cutting. • Cost trade-offs and savings opportunities can be heavily dependent on CBO Baselines and Scoring.
Under CBO’s Current Sept., 2004 Baseline, Food Stamps Are Over Half of the Costs of Programs Under the Jurisdiction of the House Agriculture Committee
CHIMPS Mandatory Program Cuts Takenby the Appropriators Appropriations cuts in mandatory programs are called CHIMPS: Changes In Mandatory Programs. • It is against the House Rules to “legislate on appropriations bills.” But appropriators indirectly do so by, for example, limiting salaries and expenses to carry out a conservation program of greater than $xxx million. • CHIMPS represent a one-way street—Appropriators can cut Ag Committee mandatory farm bill programs but Ag Committee can’t cut their discretionary programs. • For FY 04 Ag CHIMPS were 31% of total CHIMPS. Ag Appropriations are 2% of total appropriations. • Since FY 2002, $3.1 billion has been taken from House Ag Committee programs.
Consequences of CHIMPS • Producers don’t get full benefits intended when the farm bill was passed and that the Ag Committees paid for. • Upsets the delicate balances and compromises that were struck during negotiations on the 2002 farm bill. • May set up a potential fight between Ag Committees seeking reconciliation cuts and Appropriators who have come to depend on limiting our programs to make their ever tightening budget targets.
Budget Reconciliation Update (5 Nov 05) 2006 2006-2010 (----------$bil.------------) House Ag C. -.617 -3.7 Senate Ag C. -.196 -3.014 Note: Senate has passed Reconciliation bill