Download
1 / 47
470 likes | 495 Views
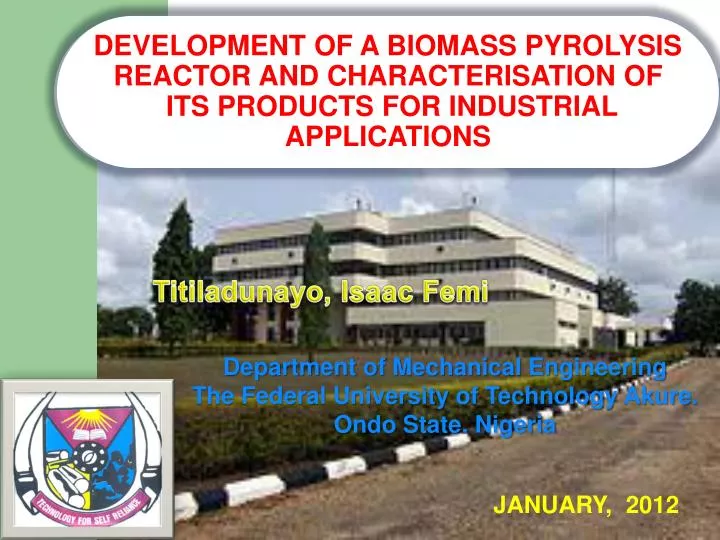
DEVELOPMENT OF A BIOMASS PYROLYSIS REACTOR AND CHARACTERISATION OF ITS PRODUCTS FOR INDUSTRIAL APPLICATIONS. Titiladunayo, Isaac Femi. Department of Mechanical Engineering The Federal University of Technology Akure . Ondo State. Nigeria. JANUARY, 2012. Introduction.

E N D
DEVELOPMENT OF A BIOMASS PYROLYSIS REACTOR AND CHARACTERISATION OF ITS PRODUCTS FOR INDUSTRIAL APPLICATIONS Titiladunayo, Isaac Femi Department of Mechanical Engineering The Federal University of Technology Akure.Ondo State. Nigeria JANUARY, 2012
Introduction • It comprises:- aggregate of all biologically produced matter inform of: • wood and wood wastes; • agricultural crops and their waste by-products; • municipal solid wastes; • animal wastes; • wastes from food processing; • and aquatic plants including sea weeds and algae (Agarwal and Agarwal, 1999; U.S Dept of Energy, 2003). • Biomass is cheap, available, affordable and reliable • It’s a regular source of rural energy in Nigeria, fuel wood is cheap, easily accessed by both rural & urban dwellers.
Introduction • Biomass – renewable, available, and abundant on earth. • It is a versatile energy and chemical resource • It could be converted into renewable products that could significantly supplement the energy needs of society
Selected Feedstock Species (B) A. africana (A) M. excelsa (C) E. guineensis Fig. 17: Sizing of Selected Feedstock for Pyrolysis Experiments
Experimentation and Documentation • Carbonisation experiments were carried out at various elevated temperatures for all samples in the developed electrically fired ‘Fixed-Bed Reactor’ at pre-determined temps., ranging from 400°C to 800°C and at 100°C intervals. • Fifteen batches (0.5 kg net weight per batch) each of the selected materials of constant moisture content were used as feedstock in 3 replicated experiments
Experimentation & Documentation Cont… • By-products of pyrolysis: • charcoal (solid fuel), • oils (liquid fuel), • and pyrogas (non-condensable gaseous products). • Experiments were conducted under a quiescent environment (insufficient or complete absence of air). • Feedstock residence time, furnace temp. and pyrolysis (reaction) temp. were recorded as displayed on the controllers and recorded every 5 min.
Experimental Set-up Fig. 18: Pyrolysis Experimental set-up
Assembling the Fixed-Bed Reactor Fig.19 Assembling the reactor for an Experiment
Fig. 20: Fully Assembled Fixed-Bed Reactor with an Ongoing Experiment
The appearance of the Fixed-Bed Reactor and Furnace at 600 °C and 700 °C respectively • Fig. 22: Appearance of the Fixed-Bed Reactor and Furnace at 6000C & 7000C respectively (During the Day)
The appearance of the Fixed-Bed Reactor and Furnace at 800 °C Day Appearance Night Appearance Fig. 23: Fixed Bed Reactor after an Experiment
Result and Discussion • The relationship between Carbonisation and reaction temperatures for the three species were positive but not linear (Fig. 4A). • The temperature interactions within species and between species were significant (p<0.05) as shown Fig.4B • The mass of the char fractions vary from one species to the other but a general mass reduction across higher temperature profile is generally noticed. • Pyrolysis oil yield also varies with temperature • The sygas fraction varies with temperature.
Result and Discussion • The mass of the char fractions vary from one species to the other but a general mass reduction across higher temperature profile is generally noticed. • Pyrolysis oil yield also varies with temperature • The sygas fraction varies with temperature. • Pyroligneous oil is used as solvent and insecticide
Table 6A: Mean and Standard Deviation of Reaction Temperature for all samples Table 6B: Variance ratios (F-calculated) from various ANOVA tables for Reaction Temperature
Effect of Carbonisation Temperature on Reaction Temperature • Fig. 24: Increase of Reaction Temperature with increasing carbonisation Temperature for all samples
Table 7: Mean Reaction Temperature between Species Alpha (α) = 0.5
Variance ratios (F-calculated) from various ANOVA Tables for Reaction Temperature Table 8: Variance ratios (F-calculated) from various ANOVA Tables for Reaction Temperature
Effect of carbonisation temperature on Residence time Across Samples Fig. 25: Effect of Carbonisation Temperature on Residence Time
Recovering Pyro-liquor through Phase change Fig.26: Pyrolysis Liquor Recovery
Recovered Pyrolysis Liquor at 400 °C, 500 °C, 600 °C, 700 °C, and 800 °C Pyro-oil from Apa Wood Pyro-oil from Palm Kernel Pyro-oil from Iroko Wood Fig. 27: Pyrolysis oil across selected samples
Fig.29: Variation of Pyro-oil yield with Carbonisation Temperature
Fig.30: Variation of Tar yield with Carbonisation Temperature
Fig. 31: Variation of Syngas yield with Carbonisation Temperature
Fig. 32: Variation of char yield with carbonisation temperature
Recovered Carbon & Smokeless Burning Charcoal B A C D Fig. 33: Charring Residues & Smokeless combustion
Residual yield per species (% wt) Fig. 34: Variation of Apa wood residual fractions with carbonisation temperature
Residual yield per species (% wt) Fig. 35: Variation of Iroko wood residual fractions with carbonisation temperature
Residual yield per species (% wt) Fig. 36: Variation of Iroko wood residual fractions with carbonisation temperature
Table 9:Char yield / 1000 kg of feedstock as a function of temperature
Table. 10: Pyro-oil yield / 1000 kg of feedstock as a function of temperature
Fig.11: Tar yield / 1000 kg of feedstock as a function of temperature
Fig.12: Syngas yield / 1000 kg of feedstock as a function of temperature
Material & Products Characterization • FTIR and TGA – Analysis • Determine: Proximate analysis of parent stock and fractions: M.C,V.M,F. C, & Ash content • Determine: Ultimate analysis (Elemental analysis of Parent stock and fractions)-C, H, O, N, S, Ash • Energy Content Analysis (HHV) • Density
Moisture Content Determination • The moisture content was determined by using METTLER TOLEDO HB 43-S Hologen, moisture Analyzer. The result is as shown in Table 3.
Density Determination • The materials were ground to pass through 2 mm filter • Dried to constant weights in the muffle furnace at 103±2°C and later cooled in the desiccator. • Three replicates (0.001kg) measured with high precision ‘METTLER Balance for compression • Pelletized in the die at a pressure of 5000 Ib/in2 (34.5 MN/m2) for all samples. The diameter (D) and height (h) of all the pellets were measured with electronic Veneer Caliper. • Density of pellet (ρ) = 4m/(πD^2 h)
Table. 7: Density of Selected Tropical Biomass (kg/m3)- Oven dry weight
Energy Content Determination • Samples were pulverized in Ball Mill, made to pass through 2 mm filter and dried to constant weight in an oven at 103±2°C. • Parr 1341 Oxygen Bomb Calorimeter was standardized with using benzoic acid in three replicates. • The standard energy was determined to be 2437.9 cal/°C (10.207 kJ/°C). • Each biomass Pellets was fired in the Bomb Calorimeter and energy determined.
CONCLUSION: • The electrically controlled thermal reactor plant for the conversion of biomass to charcoal was successfully developed. • The performance of the reactor was evaluated over a temperature range of 4000C to 8000C and was found to be effective in degrading Palm Kernel (ElaesisGuineensis) Shells, Apa wood (Afzelium Africana) and Iroko wood to charcoal at pre-determined conditions.
Conclusion Cont…. • Conversion efficiency is higher than reported in literature. • Cycle time is much reduced than reported in literature • Heat promotes the unzipping of biomass polymer chain in thermochemical reactions • Biomass’ rate of mass disappearance is a function of temperature, degree of structural polymerization, thermal conductivity, material density, heating rate, thermal intensity, and residence time among others. • Rapid evolution of volatiles is noticed from 275°C to 600°C. It reduces drastically to near zero between 700°C to 800°C for the selected biomass samples.
THANK YOU FOR LISTENING GOD BLESS YOU ALL