Download
1 / 144
1.5k likes | 1.95k Views
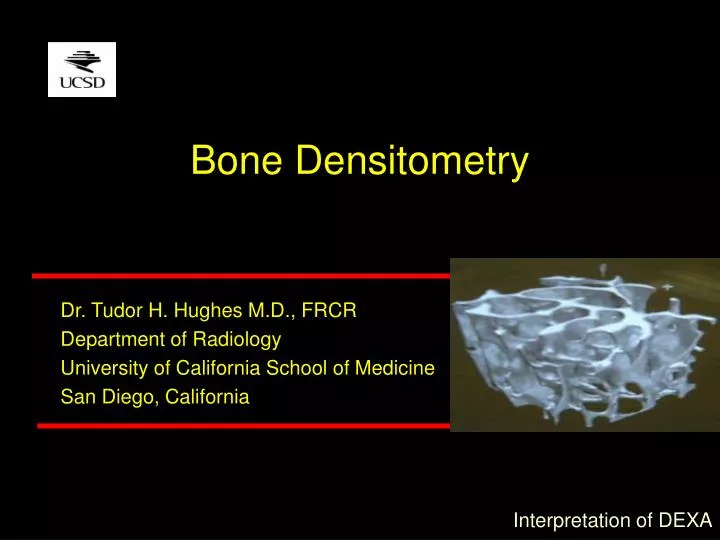
Bone Densitometry. Interpretation of DEXA. Osteoporosis.

E N D
Bone Densitometry Interpretation of DEXA
Osteoporosis • Osteoporosis is the most common metabolic bone disorder. It has been defined by the National Institutes of Health as an age-related disorder characterized by decreased bone mass and increased susceptibility to fractures in the absence of other recognizable causes of bone loss.
Osteoporosis • Risk factors • may be superimposed upon either involutional or secondary osteoporosis, including : • Smoking • Alcohol • Poor diet • Lack of exercise • An early menopause • Strong family history • Small frame
Osteoporosis • The normal rate of bone loss is 2% per year, hence 20-40% of the female bone mass is already lost by the age of 65 years of age, beginning before the menopause and accelerating afterwards
Osteoporosis Osteoporosis progression over 2Y UC Steroids 59F
Osteoporosis • Bone mass is the major determinant of bone strength that can be measured by non-invasive techniques, and accounts for 75-85% of this parameter
Osteoporosis Measurement • Plain film, • Subjective, Radiogrammetry, Osteogram • SPA • DPA • DEXA • QCT • US • MRI
Osteoporosis Measurement • Plain film, • Subjective, Radiogrammetry, Osteogram • SPA • DPA • DEXA • QCT • US • MRI
Osteoporosis Measurement • Plain film, • Subjective, Radiogrammetry, Osteogram • SPA • DPA • DEXA • QCT • US • MRI
Osteoporosis Measurement • Plain film, • Subjective, Radiogrammetry, Osteogram • SPA • DPA • DEXA • QCT • US • MRI
Osteoporosis Measurement • Plain film, • Subjective, Radiogrammetry, Osteogram • SPA • DPA • DEXA • QCT • US • MRI
DEXA DEXA has very high accuracy (the difference in the measurement from a known standard) and precision (observed deviation of serial measurements with time) both short and long term to within 1% at the hip and spine
DEXA • DEXA is at present the most precise measurement of BMD • QCT is more sensitive to change
Find out as much relevant information as possible
Find out as much relevant information as possible
Bone DensitometryDEXA spine check list • Note the age, sex, ethnicity and weight • Does this match the reference ranges? • Is the bottom of L4 roughly at the level of the iliac crests • Are there any ribs on L1 • Scoliosis • Are the vertebrae correctly divided • Anything in the soft tissue
Transitional vertebrae Wrong levels
Bone DensitometryDEXA spine check list • Look for significant level to level variations • 15-20% difference between adjacent levels
Bone Densitometry • In preventing Fxs it is the worst scenario that matters. • Generally a slight increase in density as descend the L spine. • Approx 6% increase between L1 and L4.
What’s wrong with this scan? Divisions don’t account for scoliosis
What’s wrong with this scan? Everything
DEXA Femur check listHints for a good scan. • Patient should be straight on table. • Pack patient with rice bags. • Shaft of femur should be straight. • Rotate leg inward, this will hide the lesser trochanter.
DEXA Femur check listHints for a good scan. • The Wards area is roughly half the neck area • Trochanteric area 8-14cm2 in women, 10-16cm2 in men • Check left and right and state side being used in report.
What’s wrong with this scan? Too much shaft
What’s wrong with this scan? Insufficient tissue below neck
What’s wrong with this scan? Set up for wrong leg
What’s wrong with this scan? Includes ischium
Bone DensitometryWHO uses T scores • Normal • > -1 SD below young adult • Osteopenia • -1 -2.5 SD • Osteoporosis • <-2.5 SD • Established (Manifest) Osteoporosis • + Fxs, usually spine, hip, proximal humerus, wrist, rib
007179 - Macro DEXA Template
Bone Densitometry • Never round up figures • -1 is osteopenia, -0.99 is normal • -2.5 is osteoporosis, -2.49 is osteopenia
Bone Densitometry • T score is compared to reference population, 20-45 years, same sex, any race, any weight. • Z score is matched for age, sex, weight and ethnicity.
Two possible reasons for this lady’s Z score being worse than the T score?
Two possible reasons for this lady’s Z score being worse than the T score? Obesity and race
The T score is based on a white, same sex, age 20-40population. The patient's BMD is compared to this population's BMD.A lower T score means that the patient BMD is low compared to this young, healthy normal weight population. The Z score compares the patient to an adjusted population, it adjustsfor age, weight, and ethnic background. The Z score can be lower than the T score for the patient, if the average patient in this population has a higher BMD than the average in the T score population. This can be seen in patients with higher weights, (which increases bone density), and in African American groups, (which show increased bone density). If the patients comparison group has a generally higher bone density, then it is possible to have a poorer comparison to others of same age, than to younger comparisons in generally lower density group.
Black as Black Black as White
Black as Black > Black as White T same Z up <
Bone DensitometryWeight gain/loss and Z • Weight gain(or loss) will not affect Z score comparison, since Z scores are weight matched, but should cause an increase(or decrease) in absolute BMD. • An increase in weight, pushes up the reference range, and therefore the Z score may seem reduced, and vice versa. 2.2lbs=1Kg
Bone DensitometryWeight gain/loss and T • Weight gain (or loss) should cause an increase(or decrease) in absolute BMD. • Weight gain (or loss) will affect T score comparison, since reference range will not have changed. • Hence an increase in weight with a corresponding increase in bone density, will look like a good improvement in T score, but fracture risk is unchanged.
51F 90Kg 53F 51Kg
1.172 1.176 SD = 0.1 Both between -2 and -3 SD below mean for age 1Y, 16lb gain, 5% BMD loss = significant increase in fracture risk
Bone DensitometryComparison with previous • Are the studies comparable • Always compare like with like • Thornton L1-4 • 4th and Lewis (previously L2-4) • Any intervening events • Cannot compare Hologic and Lunar