Download
1 / 20
200 likes | 311 Views
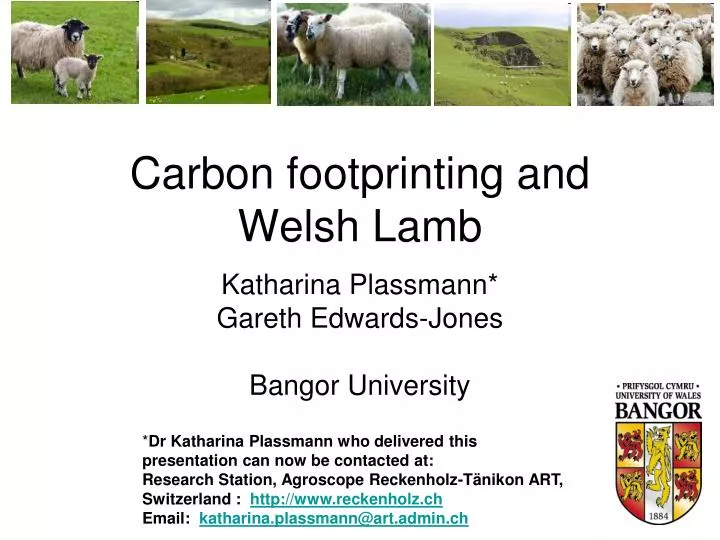
Carbon footprinting and Welsh Lamb. Katharina Plassmann* Gareth Edwards-Jones Bangor University. * Dr Katharina Plassmann who delivered this presentation can now be contacted at: Research Station, Agroscope Reckenholz-Tänikon ART, Switzerland : http://www.reckenholz.ch

E N D
Carbon footprinting and Welsh Lamb Katharina Plassmann* Gareth Edwards-Jones Bangor University *Dr Katharina Plassmann who delivered this presentation can now be contacted at: Research Station, Agroscope Reckenholz-Tänikon ART, Switzerland : http://www.reckenholz.ch Email: katharina.plassmann@art.admin.ch
Structure Background Example carbon footprint of foods Developing a carbon footprint for a sheep farm More Welsh carbon footprinting results and international comparison Uncertainty
Carbon footprint = the sum of greenhouse gases released during the full life cycle of a product (good or service)
carbon footprints are expressed as kg CO2 equivalents carbon dioxide (CO2): 1 kg = 1 kg CO2 equivalents nitrous oxide (N2O): 1 kg = 296 kg CO2 equivalents methane (CH4): 1 kg = 23 kg CO2 equivalents other greenhouse gases include CFCs, halons, methyl bromide, sulphur hexafluoride, halogenated HC, mono/di/trichloromethane…) Global warming potential
INPUTS OUTPUTS Machinery Pesticides Fertiliser Electricity Fuel Food Wastes Pollution Farm Transport Pollution Machinery Fuel Storage & processing Pollution Wastes Machinery Electricity Wastes Pollution Electricity Packaging Retail Wastes Pollution Electricity Fuel Consumption Electricity Fuel Wastes Pollution Disposal Life Cycle Assessment
Typical carbon footprints(kg CO2 equivalents per kg of food/drink)various sources
Carbon footprinting schemes International Organisation for Standardisation (ISO) Agency for the Environment and Energy Management (ADEME), France World Resources Institute (WRI) Casino, France Migros, Switzerland Leclerc, France KRAV and Svenskt Sigill, Sweden Blauer Engel (Blue Angel), Germany TÜV Nord, Germany Korea Thailand carboNZero, New Zealand Patagonia Clothes, US European Ecolabel (Eco-Flower) PAS2050, UK Ministry of Economy, Trade and Industry, Japan
Multiply emissions per unit by amount used in the system (boundary 1)
Expanding the system boundary These emissions include methane from enteric fermentation and nitrous oxides from soils and increase the emissions for this farm to: 5,227 kg CO2e/ha/year (range: 3,318 – 12,920) Add in ecosystem emissions
THANKS Conference organisers Our funders: • Farming and Wildlife Advisory Group Wales • Hybu Cig Cymru – Meat Promotion Wales • International Institute for Environment and Development • World Bank