Download
1 / 1
10 likes | 175 Views
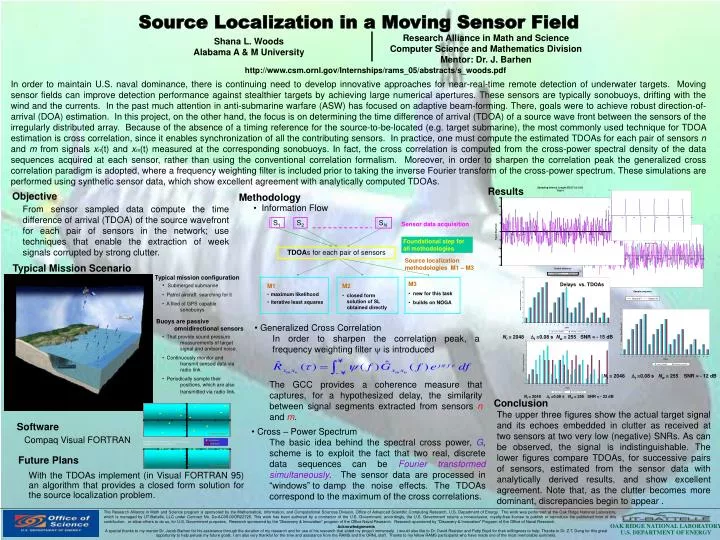
S N. S 2. S 1. Sensor data acquisition. Foundational step for all methodologies. TDOA s for each pair of sensors. Source localization methodologies M1 – M3. M3 new for this task builds on NOGA. M1 maximum likelihood iterative least squares. M2

E N D
SN S2 S1 Sensor data acquisition Foundational step for all methodologies TDOAs for each pair of sensors Source localization methodologies M1 – M3 • M3 • new for this task • builds on NOGA • M1 • maximum likelihood • iterative least squares • M2 • closed form solution of SL obtained directly sonobuoys submarine Synthetic data are generated to validate the correct implementation of the SL algorithms. x-y plane projection Software Compaq Visual FORTRAN x-z plane projection OAK RIDGE NATIONAL LABORATORY U.S. DEPARTMENT OF ENERGY Source Localization in a Moving Sensor Field Research Alliance in Math and Science Computer Science and Mathematics Division Mentor: Dr. J. Barhen Shana L. Woods Alabama A & M University http://www.csm.ornl.gov/Internships/rams_05/abstracts/s_woods.pdf In order to maintain U.S. naval dominance, there is continuing need to develop innovative approaches for near-real-time remote detection of underwater targets. Moving sensor fields can improve detection performance against stealthier targets by achieving large numerical apertures. These sensors are typically sonobuoys, drifting with the wind and the currents. In the past much attention in anti-submarine warfare (ASW) has focused on adaptive beam-forming. There, goals were to achieve robust direction-of-arrival (DOA) estimation. In this project, on the other hand, the focus is on determining the time difference of arrival (TDOA) of a source wave front between the sensors of the irregularly distributed array. Because of the absence of a timing reference for the source-to-be-located (e.g. target submarine), the most commonly used technique for TDOA estimation is cross correlation, since it enables synchronization of all the contributing sensors. In practice, one must compute the estimated TDOAs for each pair of sensors n and m from signals xn(t) and xm(t) measured at the corresponding sonobuoys. In fact, the cross correlation is computed from the cross-power spectral density of the data sequences acquired at each sensor, rather than using the conventional correlation formalism. Moreover, in order to sharpen the correlation peak the generalized cross correlation paradigm is adopted, where a frequency weighting filter is included prior to taking the inverse Fourier transform of the cross-power spectrum. These simulations are performed using synthetic sensor data, which show excellent agreement with analytically computed TDOAs. Results Objective Methodology From sensor sampled data compute the time difference of arrival (TDOA) of the source wavefront for each pair of sensors in the network; use techniques that enable the extraction of week signals corrupted by strong clutter. • Information Flow Typical Mission Scenario Typical mission configuration • Submerged submarine • Patrol aircraft searching for it • A filed of GPS capable sonobuoys • That provide sound pressure measurements of target signal and ambient noise. • Continuously monitor and transmit sensed data via radio link. • Periodically sample their positions, which are also transmitted via radio link. Delays vs. TDOAs Buoys are passive omnidirectional sensors • Generalized Cross Correlation • In order to sharpen the correlation peak, a frequency weighting filter is introduced Nt = 2048 t =0.08 s Nw = 255 SNR - 15 dB Nt = 2048 t =0.08 s Nw = 255 SNR - 12 dB The GCC provides a coherence measure that captures, for a hypothesized delay, the similarity between signal segments extracted from sensors nand m. Nt = 2048 t =0.08 s Nw = 255 SNR - 22 dB Conclusion The upper three figures show the actual target signal and its echoes embedded in clutter as received at two sensors at two very low (negative) SNRs. As can be observed, the signal is indistinguishable. The lower figures compare TDOAs, for successive pairs of sensors, estimated from the sensor data with analytically derived results, and show excellent agreement. Note that, as the clutter becomes more dominant, discrepancies begin to appear . • Cross – Power Spectrum • The basic idea behind the spectral cross power, G, scheme is to exploit the fact that two real, discrete data sequences can be Fourier transformed simultaneously. The sensor data are processed in “windows” to damp the noise effects. The TDOAs correspond to the maximum of the cross correlations. Future Plans With the TDOAs implement (in Visual FORTRAN 95) an algorithm that provides a closed form solution for the source localization problem. The Research Alliance in Math and Science program is sponsored by the Mathematical, Information, and Computational Sciences Division, Office of Advanced Scientific Computing Research, U.S. Department of Energy. The work was performed at the Oak Ridge National Laboratory, which is managed by UT-Battelle, LLC under Contract No. De-AC05-00OR22725. This work has been authored by a contractor of the U.S. Government, accordingly, the U.S. Government retains a nonexclusive, royalty-free license to publish or reproduce the published form of this contribution , or allow others to do so, for U.S. Government purposes. Research sponsored by the “Discovery & Innovation” program of the Office Naval Research. Research sponsored by “Discovery & Innovation” Program of the Office of Naval Research. Acknowledgements A special thanks to my mentor Dr. Jacob Barhen for his assistance through the duration of my research and for use of his research that aided my project immensely. I would also like to Dr. David Resister and Patty Boyd for their willingness to help. Thanks to Dr. Z.T. Deng for this great opportunity to help peruse my future goals. I am also very thankful for the time and assistance from the RAMS and the ORNL staff. Thanks to my fellow RAMS participants who have made one of the most memorable summers.