Download
1 / 3
40 likes | 58 Views
TradingView is a platform where you can analyze and understand charts and interact with other traders and their investment ideas. For more information visit on https://zerostockbrokerage.com/understanding-trend-analysis-with-tradingview/<br>u2022tOpen Demat Account Online<br>u2022tZerodha demat account<br>u2022tHow To Open Zerodha Account Opening Online<br>u2022tWhat are chart patterns<br>

E N D
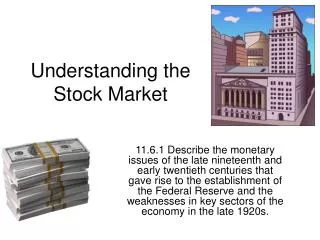
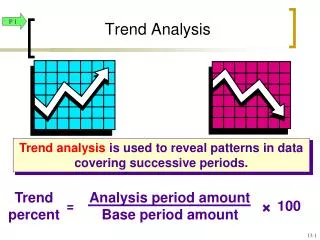
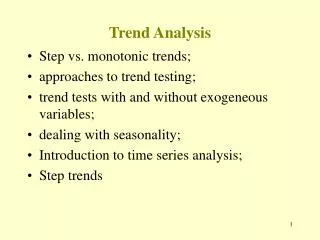
Understanding Trend Analysis with TradingView TradingView is a platform where you can analyze and understand charts and interact with other traders and their investment ideas. TradingView offers you the largest library of ideas and strategies, with over 100,000 strategies written by other traders and members of the community. the members share their ideas and scripts, on the TradingView market. (Read more) Trend analysis is without a doubt, the most powerful area of technical analysis. It helps you determine the overall direction of an asset and work on the principle of higher highs, higher lows (for an uptrend), and lower highs, lower lows (for a downtrend). There can be different time zones, that basically tell when the market will respond by making a strong advance or decline. These time zones also keep reversing roles between support and resistance. Support & Resistance Support and resistance help you identify the points at which the price reacted either by reversing or at least by slowing down, historically. Knowing prior price changes can also help you determine the future of the asset. Support and resistance are very important techniques and mastering the technique require hours of practice. Supply and demand Based on the ancient principles of supply and demand, this technique determines how and where the price is flowing. The strategy revolves around the number of assets available and the number of buyers for that asset. A demand zone is created where demand overwhelms supply
and a supply zone is created were where demand overwhelms supply. Ideally, the demand zone is to buy, and the supply zone is to sell, but fres zones are more effective. Pivot points Pivot points help you determine the points or levels, at which the price may react to. Sometimes, pivot points also act as support and resistance and can be the turning points of a price. Fibonacci Based on the principle of Fibonacci numbers, can be used to find out levels at which the price will come back before it continues the trend. It's a simple division of the vertical distance between a significant low and a significant high (or vice versa) into sections based on the key ratios of 23.6%, 38.2%, 50%, and 61.8%. Trend lines Trend lines can help you identify and confirm trends. These are basically connecting 2 points on a chart, and when extended forward, they can tell you the areas of support and resistance. Candlestick analysis Usually combined with support and resistance, the candlestick determine were the market direction, by reading individual candles, pairs, or at most, triplets. The candle comprises two parts, the body, and the wick, and every candle contains four types of information, the high, the low, the open, and the close. the body sows the net price movement between open and close while the wicks show reversals that occurred within the timeframe of the candle. Multiple Time Frame Analysis Traders analyze several time frames of an asset, before buying the trade. This is done to identify the best entry points and traders who use this analysis usually analyze 3-4 time frames, start from the highest, and going down to the lowest. Seasonality Seasonality refers to a phenomenon that believes that price undergoes similar and predictable changes around the same period within every calendar year. You can find the seasonality of a pattern and use it to predict a trend, that makes seasonality a very powerful tool. Fractals Fractals are building blocks of a trend and are used by traders to confirm a trend. Fractals lag the market and can exhibit the same characteristics as patterns when broken up. These can include a minimum of 5 bars, and this number can go up to infinite. Economic cycles These cycles have four distinct periods: improvement, prosperity, recession, and depression. These names may differ, but the basic idea remains the same.
Improvement:rising economic activities, increase in production and employment, usually a transition from depression to prosperity. Prosperity:rising interest rates, inflation, high income Recession:atransition from prosperity to depression, falling income, a decline in demand, falling stock markets Depression: a decline in consumption and demand, falling interest rates, deflation, low income. You can always find out which sector performs the best in which cycle and then decide if you want to invest in it or not. Read more: How To Open Zerodha Account Opening Online