Download
1 / 81
890 likes | 1.12k Views
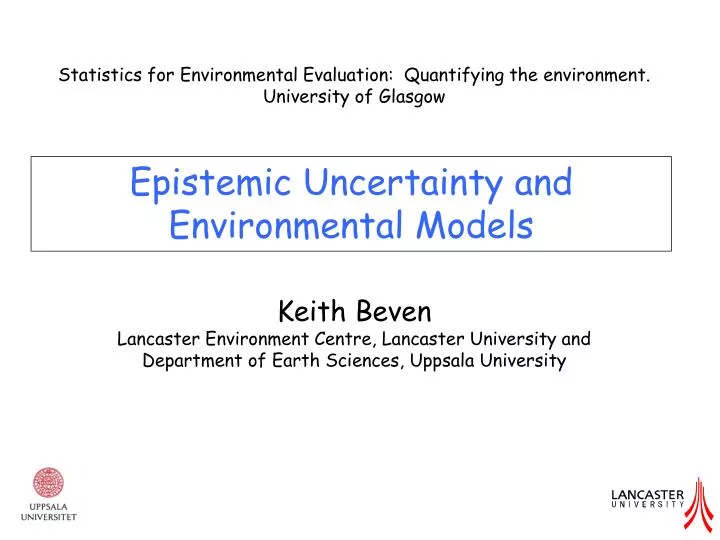
Statistics for Environmental Evaluation: Quantifying the environment. University of Glasgow Keith Beven Lancaster Environment Centre, Lancaster University and Department of Earth Sciences, Uppsala University. Epistemic Uncertainty and Environmental Models. My background. I am a hydrologist

E N D
Statistics for Environmental Evaluation: Quantifying the environment. University of Glasgow Keith Beven Lancaster Environment Centre, Lancaster University and Department of Earth Sciences, Uppsala University Epistemic Uncertainty and Environmental Models
My background • I am a hydrologist • I have worked at the Institute of Hydrology and Universities of Leeds, Virginia and Lancaster, with visiting positions at UC Santa Barbara, EPFL Lausanne, KU Leuven, Uppsala University, and LSE London • I have worked on many hydrological models (Topmodel, IHDM, SHE, MIPs, DBM….) and 1D/2D hydraulic models (HEC-RAS, ISIS, JFLOW,….) • Interests in floods, flood forecasting, future change, residence times and travel times of pollutants • And uncertainty (Generalised Likelihood Uncertainty Estimation, GLUE, methodology)
My background • Started doing Monte Carlo experiments on models at the University of Virginia in 1980 (start of GLUE and equifinality concepts) • 80’s - Used Monte Carlo in continuous simulation for flood frequency estimation • Moved to Lancaster 1985, continued GLUE work, first publication with Andrew Binley in 1992. • Most recent thoughts on how to do science given uncertainties in CRAS Geosciences 2012 paper and “GLUE 20 years on”paper in Hydrol. Process. 2013 • Current CREDIBLE project on uncertainty in risk assessments for natural hazards for NERC • Uncertainty work has been summarised in a book.
The Book!!…… in Environmental Modelling: An Uncertain Future? Routledge, 2009 ISBN: 0-415-46302-2 More information at www.uncertain-future.org.uk
The Perceptual Model (ideas) The Conceptual Model (equations) The Procedural Model (code) Model Calibration (may be difficult?) Estimation of predictive uncertainty Model Validation (may be impossible? - but a good idea !!) Increasing Approximation The Modelling Process • Declare Success ? • Use in decision making?
Uncertainty in Environmental Models - Why should we be interested in uncertainty? • Models are wrong and are known to be wrong … (Adam Morton) • but might still be useful in real applications….(George Box) • Input and boundary condition data are wrong and are known to be wrong • Parameter values might have physical significance, but the values we can measure in the lab or field may not be the values that are required to make the model work (therefore some calibration usually needed) • Observations with which we can check a model are wrong and are known to be wrong • Result that may be rather difficult to differentiate between different models as hypotheses (the equifinality thesis) • Might there be better ways of doing environmental science?
Uncertainty estimation methods • Three different types of problem: • Forward uncertainty estimation (no data to assess residuals – must depend totally on assumptions about sources of uncertainty) • Model conditioning (historical data to assess residuals in calibration period – learn about errors for use in prediction) • Real-time data assimilation (can assess residuals in real-time and update forecasts and forecast uncertainty – especially used in flood forecasting –)
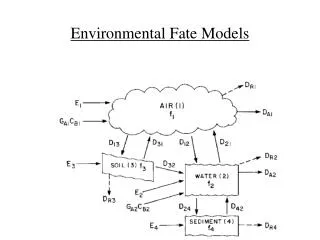
Pattern of rainfall inputs Pattern of actual evapotranspiration Hydrology as one of the inexact sciences Changes of storage Catchment area Heterogeneity of soils & representation of flow processes Flow through bedrock? Land Management Effects on soil & surface Discharge estimates (requires “rating curve”) A/E/D
Sources of Uncertainty • Errors in the input and boundary condition data • Errors in the model structure • Errors in estimates of parameter values • Commensurability of modelled and observed variables and parameters • Errors in the observations used to calibrate or evaluate models • Errors of omission (not always the unknown unknowns) • ……
Sources of Uncertainty • Errors in the input and boundary condition data • Errors in the model structure • Errors in estimates of parameter values • Commensurability of modelled and observed variables and parameters • Errors in the observations used to calibrate or evaluate models • Errors of omission (not always the unknown unknowns) • Difficult (impossible) to disentangle different sources of error without making strong assumptions • (Water Science and Technology, 2005)
Types of Uncertainty (and why they are important) Aleatory Uncertainty Epistemic Uncertainty System Dynamics Forcing and Response Data Disinformation Semantic/Linguistic Uncertainty Ontological Uncertainty Beven, Leonardo Lecture: Facets of Uncertainty, Hyd.Sci.J. 2014
Aleatory Uncertainty Aleatory Uncertainty Uncertainty with stationary statistical characteristics. May be structured (bias, autocorrelation, long term persistence) but can be reduced to residual stationary random component Important because: Full power of statistical theory can be used to estimate the probability of matching a new sample or observation conditional on the model
Epistemic Uncertainty (System Dynamics) Epistemic uncertainty arising from a lack of knowledge about how to represent the catchment system in terms of both model structure and parameters. Note that this may include things that are included in the perceptual model of the catchment processes but which are not included in the model. They may also include things that have not yet been perceived as being important but which might result in reduced model performance. Important because: May result in non-stationarity in residual characteristics that if it cannot be represented explicitly might lead to overconfidence in inference
Epistemic Uncertainty (Forcing and Response Date) Epistemic Uncertainty arising from lack of knowledge about the forcing data or the response data with which model outputs can be evaluated. This may be because of commensurability or interpolation issues when not enough information is provided by the observational techniques to adequately describe variables required in the modelling process. Important because: May result in non-stationarity in residual characteristics that if it cannot be represented explicitly might lead to overconfidence in inference
Epistemic Uncertainty (Disinformation) Analogous to known unknowns (in either system representation or forcing data that are known to be inconsistent or wrong. Will have the expectation of introducing disinformation into the modelling processes resulting in biased or incorrect inference (including false positives and false negatives in testing models as hypotheses) Important because: May feed disinformation into the model identification process
Disinformation in calibration data Application of WASMOD to Pasa La Ceiba, Honduras (from Ida Westerberg, Uppsala)
Disinformation in calibration data Application of WASMOD to Pasa La Ceiba, Honduras (from Ida Westerberg, Uppsala)
Semantic/Linguistic Uncertainty Uncertainty about what statements or quantities in the relevant domain actually mean (there are many examples in hydrology including storm runoff, baseflow, hydraulic conductivity, stationarity etc). This can partly result from commensurability issues that quantities with the same name have different meanings in different contexts or scales. Important because: May limit effective information content in inference if compare variables that do not have the same meaning
Ontological Uncertainty Uncertainty associated with different belief systems. Relevant example here might be beliefs about whether formal probability is an appropriate framework for the representation of mode errors. Different beliefs about the appropriate assumptions could lead to very different uncertainty estimates. Important because: All the previous definitions may be subject to ontological uncertainty.
Types of error and why they are important Aleatory (A), Epistemic (E) or Disinformative (D) • Errors in the input and boundary condition data (A/E/D) • Errors in the model structure (E/D?) • Errors in estimates of parameter values (A/E) • Commensurability of modelled and observed variables and parameters (A/E/D) • Errors in the observations used to calibrate or evaluate models (A/E/D) • Errors of omission (sometimes known omissions) (E/D?) • The unknown unknowns (D?, becoming E/D)
Example Aleatory and Epistemic Uncertainties from Hydrological Modelling
Example Aleatory and Epistemic Uncertainties from Hydrological Modelling
Activity Make a list of the most important uncertainties in your modelling activity. Classify these under the following headings: 1. Essentially random 2. Lack of knowledge about how to represent some processes (including different theories/belief systems about how to do so) 3. Lack of knowledge about how to define parameter values at scale of the model 4. Lack of knowledge about boundary conditions or forcing data 5. Lack of knowledge about how observables relate to model variables in model calibration/evaluation/verification 6. Unknown unknowns
Activity (2) What effect do you expect the epistemic uncertainties to have on model simulations? Is there evidence in current model results to suggest they might be important? Is there evidence that some calibration/evaluation/verification data might be disinformative?
Uncertainty about uncertainty estimation • Many sources of uncertainty in the modelling process but can generally only evaluate the differences (residuals) between some observed and predicted variables (e.g. water levels, discharges, ……) • Leaves lots of scope for different interpretations and assumptions about the nature of different sources of uncertainty • Model structural error particularly difficult to assess (not easily separated from input and other uncertainties without making strong and difficult to justify assumptions) – often assessed AS IF model is correct • Therefore lots of uncertainty estimation methods
Statistical Uncertainty Estimation • Treat the optimal model as if it were the “true” model • Fit a model to the residuals using appropriate assumptions (e.g. residuals are of zero mean and constant variance and uncorrelated in time/space - or something more realistic, with bias, non-constant variance {heteroscedasticity}, and correlated residuals) • Nature of error model defines a likelihood function • Sum of model + error distribution can be used to estimate likelihood (probability) of predicting an observation given the model • Problem that treating multiple sources of error as if all “measurement error”
The Conditioning Process Bayes Equation Rev. Thomas Bayes (1701?-1761): “Essay towards solving a problem in the doctrine of chances”, Royal Society 1763 (also Laplace, 1816) P(H|E) = P(H) L(H|E) / C P(H) is some prior probability of a hypothesis, L(H|E) is the likelihood of a hypothesis given the evidence C is a scaling constant to ensure that the cumulative of the posterior probability density P(H|E) is unity. Often now used in form of prediction of observations O given model M: P(O|M) = P(M) L(O|M) / C
Likelihood and Model Evaluation • Model evaluation normally based on residuals in space and time ε(x,t) • ε(x,t) = O - M(Θ, I) • Made up of multiple contributions • ε(x,t) = εM(θ, εθ, I, εI, x, t) – εC(Δx,Δt, x,t) - εO(x,t) + εr • where εM(θ, εθ, I, εI, x, t) is the model error (as affected by parameter and input error • εC(Δx,Δt, x,t) denotes the commensurability error between observed and predicted values • εO(x,t) is the observation error, and • εr is a random(?) error component
Model Calibration and Model Structural Error: formal Bayesian approaches • As soon as a new observation becomes available then a new residual error can be calculating information from the new observation as • ε = O - M(Θ, I) • Assuming (for the moment) the model to be unbiased, the contribution to likelihood function from a single residual is assumed (after Gauss) to be given by
Model Calibration and Model Structural Error: formal Bayesian approaches • Applying Bayes equation over n such residuals, assuming independence, the contributions can be multiplied so that: • For the assumption of the Gaussian distributed errors, the final form of the likelihood function is given by.
An aside…… • All these likelihoods based on normal distribution assumptions for the errors derive from Gauss assumption that errors as probabilities are proportional to square of the error (the L2 norm) • Earlier work by Laplace (who independently derived a discrete form of Bayes equation in 1816) based on absolute errors (the L1 norm, see Tarantola, 2005) • Less affected by outliers….but not so convenient for analytical calculations in pre-computer era
But what if residual series shows complex (non-stationary?) structure? • Many reasons why error structures might be complex • Inconsistent observations • Effects of processing input error through model structural error in time and space (might lead to non-stationary correlation…) • Incommensurable observed and predicted variables • Sample from long term stationary stochastic behaviour • ….
Non-stationarity in validation data Application of HYMOD to Leaf River (Vrugt et al., SERRA, 2009)
Do Statistical Error Models lead to Over-Conditioning when Epistemic Uncertainty Important? • Assume standard (aleatory) likelihood with Gaussian information, mean bias, lag 1 correlation. • Likelihood ratio for 2 models with similar error variance • See discussions in Beven J.Hydrology, 2006; CRAS Geosciences, 2012 Years of data
Do Statistical Error Models lead to Over-Conditioning when Epistemic Uncertainty Important? • Assume standard (aleatory) likelihood with Gaussian information, mean bias, lag 1 correlation. • Likelihood ratio for 2 models with similar error variance • See discussions in Beven J. Hydrol., 2006; CRAS Geosciences, 2012 100 10-20 10-40 Years of data
Alternative Frameworks • Allowing that epistemic uncertainties may not be represented as simple statistical functions • Informal likelihoods (no longer P(O|M) but can be used to estimate P(M|O)) • Fuzzy / possibilistic methods • Dempster-Shafer Evidence Theory • …. • See Zadeh, Klir attempts to produce general unified theories of uncertainty
Generalised Likelihood Uncertainty Estimation (GLUE) • Based on rejection of the idea of parameter optimisation: will not be robust to calibration period, performance measure or measurement errors – concept of equifinality • [Beven, J Hydrology, 2006, Manifesto for the Equifinality Thesis] • Can then only assess the likelihood of different models being good predictors of the system of interest • Can reject (give zero likelihood) to those models that are not good predictors of calibration data • Can take account of different model structures as well as different parameter sets • Can treat complex errors implicitly (so no need for formal error model)
Uncertainty as a likelihood surface in the model space • Basic requirements of a likelihood as belief • Should be higher for models that are “better” • Should be zero for models that do not give useful results • Scaling as relative belief in a hypothesis rather than probability • But how then best to determine weights from evidence given epistemic uncertainties??
Testing models as hypotheses • Models as multiple working hypothesis about functioning of system – can hypotheses be rejected on basis of uncertain information available? • Two conflicting requirements (analogy with Type I and Type II errors) – do not want to reject a good model as non-behavioural because of input error & do not want to retain a poor model as behavioural by using a compensatory error model • JH Manifesto idea – set up limits of acceptability (reflecting observation error, commensurability error and input error) prior to running the model • But…“Best available” model may not be “fit for purpose” (allowing for uncertainty)
A framework for model evaluation • 1. Eliminate obviously disinformative data • Set up limits of acceptability (reflecting observation error, commensurability error and input error) prior to running the model. • For each model run, evaluate performance against limits of acceptability • 4. Check for error reconstruction to improve predictions / calculate distributions of errors.
Identifying disinformative data • First criterion: Event mass balance consistency (expectation that event runoff coefficient Q / R will be less than one) • But…difficulty of separating events • and impact of an inconsistent event on model results might persist for following events, gradually decaying Separation of Events Master Recession Curve
Setting Limits of Acceptability prior to running a model Results of runoff coefficient determination for River Tyne at Station 23006 – plotted against rainfall totals over catchment area as estimated from 5 gauges (black – range 0.3 to 0.9) Master Recession Curve Beven et al, HESS, 2011
Limits of acceptability • The question that then arises within this framework is whether, for an particular realisation of the inputs and boundary conditions, εM(θ, I, εI, x, t) is acceptable in relation to the terms εO(x,t) + εC(Δx,Δt, x,t). This is equivalent to asking if the following inequality holds: • Omin(x,t) < M(θ, I, εI, x, t) < Omax(x,t) for all O(x,t) • where Omin(x,t) and Omax(x,t) are acceptable limits for the prediction of the output variables given εO(x,t) and εC(Δx,Δt, x,t) • Idseally, limits of acceptability should be evaluated prior to running the model (but note I,εI in M(θ, I, εI, x, t) )
Model Evaluation using Limits of Acceptability • Likelihood can be developed based on scaled deviation away from observation, with zero value at any time step that prediction lies outside limits.
Predictive distribution over all behavioural models: what if predictions do not encompass new observation Model Predictions Observation Limits of acceptability
Experimental evidence of equifinality: Application of Dynamic TOPMODEL to Slapton Wood The Dotty Plot
Application of Dynamic TOPMODEL to Slapton Wood:Validation Period Prediction Limits
Published Applications of GLUE • Rainfall-runoff and soil water flow modelling • Stochastic rainfall models • Radar Rainfall calibration • Modelling catchment geochemistry • Modelling flood frequency • Modelling flood inundation • Modelling river dispersion • Modelling soil erosion • Modelling land surface to atmosphere fluxes • Modelling atmospheric deposition and critical loads • Modelling groundwater capture zones • Modelling groundwater recharge • Modelling water stress cavitation and tree death • Modelling forest fires • Modelling growth of tree stands
Application of Topmodel to River Brue • Hyrex experiment: 135 km2, 49 raingauges
Application of Topmodel to River Brue • Example of uncertain rating curve