Download
1 / 66
660 likes | 835 Views
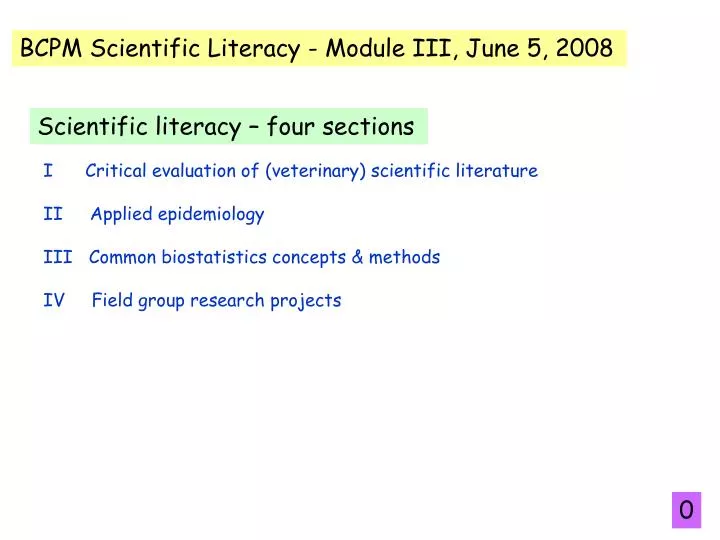
BCPM Scientific Literacy - Module III, June 5, 2008. Scientific literacy – four sections. I Critical evaluation of (veterinary) scientific literature II Applied epidemiology III Common biostatistics concepts & methods IV Field group research projects. 0.

E N D
BCPM Scientific Literacy - Module III, June 5, 2008 Scientific literacy – four sections I Critical evaluation of (veterinary) scientific literature II Applied epidemiology III Common biostatistics concepts & methods IV Field group research projects 0
BCPM Scientific Literacy - Module III, June 5, 2008 Agenda items 1. Three critical reviews of scientific papers Jeffrie Fox & Brad Jones Sowell et al, 1999. Feeding and watering behavior of healthy and morbid steers in a commercial feedlot. J Ani Sci 77(5): 1105-1112. Tom Furman & Jeff Ondrak Ellis et al, 2002. Comparative efficacy of an injectable vaccine and an intranasal vaccine in stimulating Bordetella bronchoseptica-reactive antibody responses in seropositive dogs. JAVMA 220(1):43-48. John Davidson & Richard Linhart Barling et al, 2005. Acute trichomoniasis and suboptimal bull fertility in a cow/calf herd: an investigation and case management. Bovine Practitioner, 39(1):1-5. 1
Scientific literacy - Agenda items - cont 2. Keen - Common biostatistics concepts 3. Group research projects • 10 to 15 minute oral presentation update by each project group on state of your project (who, what, when, where, why, how?) 4. Dave Smith – Diagnostic test evaluation 2
BCPM Research Project - resources & support materials Module III – 5 June 2008 • Little Handbook of Statistical Practice • Gerard Dallal, Tufts University PhD biostatistician • http://www.tufts.edu/~gdallal/LHSP.HTM • Some Aspects of Study Design • Gerard Dallal, Tufts University PhD biostatistician • http://www.tufts.edu/~gdallal/STUDY.HTM • Some Statistical Basics • B Gerstaman San Jose State Univerity, • DVM PhD epidemiologiost/biostatistician • http://www.sjsu.edu/faculty/gerstman/EpiInfo/basics.htm • Data Management - B Gerstaman San Jose State University, • DataEntry.pdf – two page pdf file on BCPM website • EpiData – non-spreadsheet freeware for data management • http://www.epidata.dk => can download software here • http://www.epidata.org/wiki/index.php/Field_Guide 3
BCPM Research Project - resources & support materials -continued Module III – 5 June 2008 • British Medical Journal – Statistical Notes • Gerard Dallal Website, Tufts University • http://www.tufts.edu/~gdallal/bmj.htm (link to articles) An excellent & ongoing series of short articles on use of statistics in bio-medicine published on occasional basis since mid-1990s 4
LittleHandbookofStatisticalPracticeDallal.pdf (3 page Table of contents only on BCPM website) http://www.tufts.edu/~gdallal/LHSP.HTM 5
Some Aspects of Study Design Gerard Dallal, Tufts University biostatistician http://www.tufts.edu/~gdallal/STUDY.HTM StudyDesignDallal.pdf (21 page complete pdf on BCPM website) 6
Some Statistical Basics - B Gerstaman San Jose State Univerity, http://www.sjsu.edu/faculty/gerstman/EpiInfo/basics.htm Some Statistical Basics Gerstman.pdf (8 page complete pdf file on BCPM Website) 7
DataEntry.pdf (2 page pdf on BCPM website) 8
EpiDataIntro.pdf (from B Gerstman) 9
BCPM Critical Scientific Review Being able to critically read an article puts the power back in your hands, freeing you from an overreliance on "experts". Reading a paper requires addressing the same three basic issues: validity, results & relevance A researcher is in a gondola of a balloon that loses lift and lands in the middle of a field near a road. Of course, it looks like the balloon landed in the middle of nowhere. As the researcher ponders appropriate courses of action, another person wanders by. The researcher asks, "Where am I?" The other person responds, "You are in the gondola of a balloon in the middle of a field." The researcher comments, "You must design clinical trials." "Well, that’s amazing, how did you know?" "Your answer was correct and precise and totally useless." 10
BCPM Critical Scientific Review support materials Follies and Fallacies in Medicine - Petr Skrabanek Follies-and-Fallacies-in–Medicine-1up.pdf - 183 page pdf file in BCPM website (out of print book) Scepticemia 11
Excerpt from Follies & Fallacies In Medicine 13
Research projects An important scientific question is important because of the question, not the answer 14
Common problems in study protocols • Too ambitious - too many questions (false economy) • Insufficient attention to literature (repeat history) • Poor justification • why is it important to answer this question? • what impact does it have? • Poorly formulated objectives • Inappropriate analysis • Inadequate description • Absence of pilot data 15
Epi & biostats – important issues “ There is no biological or life science where the epidemiologic approach and principles cannot be applied .” 15
Epidemiology (from Greek roots) epi = on, upon demo = people or population logos = knowledge, understanding Translation - the study of what befalls the population = medical or veterinary ecology = Disease patterns that exist under field conditions Therefore, epidemiology must be applied in the field to be effective 16
Two major epidemiology concepts 1. Epidemiology is the science of denominators Thus, it is the rationale counterbalance to clinical medicine which tends to be preoccupied with numerators (ie cases)” Clinical => focus on patients, cases & individuals versus Epidemiology => focus on both sick & healthy animals & on groups (not just individuals) Sick animals = Numerator = ____Cases____ Sick + healthy animals Denominator Population at risk - Denominators permit calculation of risk, rates & ratios 17
Types of epidemiology Chronic disease = non-infectious diseases epidemiology (eg heart attacks or diabetes) Infectious disease = infectious diseases epidemiology (eg brucellosis, avian influenza) • Descriptive epidemiology = summarize what is happening in groups by counting or measuring events and rates • by place of event of interest occurrence • by time of event of interest occurrence • by demography (eg animal age, breed, gender, parity) Analytical epidemiology = compare groups for important differences in clinical (sickness, death) or other (eg production performance) outcomes 18
Epi & statistics “It is as important to know what kind of man has the disease as it is to know what kind of disease has the man Osler, 1849-1919 “Medical statistics will be our standard of measurement; we will weigh life for life and see where the dead lie thicker, among the worker or the privileged” Virchow, 1849 19
Two major epidemiology concepts (cont) • 2. Disease occurrence is not random • - The critical epidemiologic assumption • - Goals of epidemiology • a. Identify the disease occurrence pattern • b. Determine key determinants = risk factors which can be • manipulated • -Biostatistics => tool used to detect randomness or patterns 15
Types of Distributions Non- RANDOM RANDOM UNIFORM/DISPERSED CLUSTERED • Random - any point equally likely to occur at any location and the position of any point not affected by the position of any other point. • Uniform - every point is as far from all of its neighbors as possible; • “unlikely to be close” • Clustered – many points concentrated close together and there are large areas that contain very few, if any, points; “unlikely to be distant” 16
Distribution of world airports 3100 airports in 220 countries In nature or human culture, few distributions are random 17
Epidemiologic inference • Descriptive • epidemiology • Who? • What? • Where? • When? • How many? • Rule out • Bias • Chance • Confounding • Descriptive study • Design • Implement • Analyze • Interpret Observe • Analytic • epidemiology • Why? • How? • Control for • Bias • Chance • Confounding • Analytic study • Design • Implement • Analyze • Interpret Compare subgroups Hypothesize Epidemiologic inference Causal inference 17
"The main point is gained if the student is put in a position not to be paralyzed by the mere mention of such things but ... feels that they are inherently rational and manageable and that if he encounters them he will be in a position to find out, at need, what to do with them." RA Fisher on teaching intro statistics 18
Statistics - science of collecting, organizing, summarising, analysing, and making inference from data Descriptive collecting, organizing, summarising, analysing, and presenting data Inferential making inferences, hypothesis testing determining relationships, making predictions Dr.H.Qotba
Statistical study summary 1. There exists a Parameters Population 2. An investigator draws a 5. Used to estimate Statistics Random sample 4. Used to evaluate pertinent Numerical data 3. The sample generates 19
Statistical inference • A user of statistics is always working in two worlds! • Ideal world – population level • World of reality – sample level • Statistical Inference • The process whereby one draws conclusions about a population from the results observed in a sample from that population. 20
Statistical inference • Two categories of inference • Estimation (point & interval eg mean + 95% CI) • Estimating the value of an unknown *population parameter • Predicts the most likely location of a population parameter • eg “What is the prevalence ofTritrichomonas foetus in bulls in Texas? (point estimation) • Hypothesis testing • Making a decision about a hypothesized value of an unknown population parameter • eg Is prevalence of Tritrichomonas foetus in bulls in Texas higher than in Nebraska? (Yes or No?) 22
Statistical inference • Three questions concerning a random variable of interest at the population level: • What is the location? • How much variation? • What is the shape of the distribution? • Do the values of the variable tend to fall into a bell-shaped, flat, u-shaped, or some other distinctive pattern? • A common distribution is the normal distribution.
Threats to validity 1. Chance – random error, two types - False positive association = convict the innocent p value, alpha p = 0.05, confidence intervals (precision) - False negative = free the guilty Power 2. Bias => systematic error, many types -Selection bias -Measurement bias 3.Confounding
True association causal non-causal Chance? Confounding? Bias? Should I believe my measurement? Mayonnaise Salmonella RR = 4.3 Domain of statistics Domain of proper design 21
Errors • Two broad types of error • Random error - reflects amount of variability • Chance? • Systematic error (Bias) Definition of bias Any systematic error in an epidemiological study resulting in an incorrect estimate of association between exposure and risk of disease
Imprecision & Bias - target analogy Systematic error (bias): off base on the average Random error (imprecision): scatters about the target
Errors in epistudies Error Random error (chance) Systematic error (bias) Study size Source: Rothman, 2002
The main purpose of analytic epidemiology is to attempt to overcome bias. It is not easy to overcome bias. One major reason for epi noise (eg non-repeatability of studies)
Systematic Error (Bias) • Bias is a systematic error in inference • Consider the direction of bias • Toward the null (effects are underestimated) • Away from the null (effects are overestimated) • Three categories of bias • Selection bias • Information bias • Confounding
Selection Bias • Selection bias: selection of study participants in a way that favors a certain outcome • Examples (pp. 229 – 231) • Publicity bias • Healthy worker effect. • Historical illustration: Dewey Defeats Truman. Republicans were more likely to be polled than Democrats
Example of Information Bias: “The Loaded Question” • A loaded question is a question with a false, disputed, or question-begging presupposition • "Have you stopped beating your wife?" presupposes that you have beaten your wife prior to its asking. There are only the following possible answers, both of which entails the presupposition of the question: • "Yes”, which entails "I was beating my wife." • "No”, which entails "I am still beating my wife.”
Hypothesis Tests are not Perfect Measurement error, bias, confounding
Confidence Intervals • The “95% confidence interval” is the range of values for which there is a 95% chance it contains the true value of the difference between groups • This probability is not constant across the confidence interval • The narrower the confidence interval, the more precise the estimate
The Confidence interval • Picture the mean (an estimate) with an interval around it. • The interval is a “random” interval with endpoints that are calculated and based on the sample information. • The Interval has a probability associated with it – the confidence associated with the estimated mean • Example: 95% confidence interval • Probability of trapping the population mean is 95/100 – 5 intervals will not “trap” due to chance!
Confidence intervals - Coin Toss Example Precision vs sample size
Preference for Confidence Interval • In Comparison 1 • Wt. Loss = 7Lbs • P = 0.0005 • 95% CI (5-8) • In Comparison 2 • Wt Loss = 7 Lbs • P = 0.0047 • 95%CI (3-11) Evidence-Based Medicine 2005;10:133-134
P < 0.05 It is not a good description of information in the data
Variables • Quantitative • Discrete • Continuous • Qualitative • Ordinal • Categorical
Data types • Quantitative data • Produced when one either measures or counts a characteristic for each sample element. • Measured characteristic • e.g., weight, age • Continuous data with meaningful scale • No gaps between data values • Counted characteristic • e.g., number of piglets • Discrete data, integer data
Data types • Qualitative data • Produced when one groups each sample element into distinct categories based on the “value” of a specific characteristic. • Categorical data • Two types – nominal and ordinal • Nominal • Groups without inherent ordering (breed) • Ordinal • Groups with inherent ordering (body condition score) • Quantitative and qualitative data are summarized, analyzed, and graphically presented in different fashions.