Download
1 / 59
590 likes | 691 Views
Social Times of Network Spaces. David Stark and Balazs Vedres. Processes of network evolution. to model, from its inception, network formation across an entire epoch of economic transformation. Embeddedness of foreign capital?.

E N D
Social Times of Network Spaces David Stark and Balazs Vedres
Processes of network evolution to model, from its inception, network formation across an entire epoch of economic transformation
Embeddedness of foreign capital? analytic move from how a national economy is integrated into the world economy to whether and how FDI is integrated into local networks
Methodological innovation We modify analytic tools from DNA sequencing to reconcile the structural focus of social network analysis with the temporal orientation of historical sociology Structure as topology and temporality
Emergence of domestic networks • Massive decline of state ownership • Extraordinary institutional uncertainty • Ambiguity about the rules of the game
Foreign investment • Did massive FDI eradicate networks? • Which forms were open or closed to FDI? • Do foreigners build domestic networks?
Our question Can networks of global reach coexist and entwine with those of local embeddedness? Restated, can FDI be integrated into national networks? And, if so, how?
Data • Largest 1,800 firms of the period by revenue between 1987-2001 • Ownership data from registry courts • names of top 25 owners and their shares • all changes recorded for the whole life of the firm • A tie is a direct ownership stake by one of our 1,800 firms in one of the other firms in that same population (i.e., not an “affiliation network”)
The ‘network movie’ Animation of network emergence
Month 1 December, 1987
Month 2 January, 1988
Month 3 February, 1988
Month 4 March, 1988
Month 5 April, 1988
Month 6 May, 1988
Month 7 June, 1988
Month 8 July, 1988
Month 9 August, 1988
Month 10 September, 1988
Month 11 October, 1988
Month 12 November, 1988
Month 13 December, 1988
Month 14 January, 1989
Month 15 February, 1989
Month 16 March, 1989
Month 17 April, 1989
Month 18 May, 1989
Month 19 June, 1989
Month 20 July, 1989
Month 21 August, 1989
Month 22 September, 1989
Month 23 October, 1989
Month 24 November, 1989
Month 25 December, 1989
Month 26 January, 1990
For historical network analysis from a kind of aerial sociology to the network histories of 1,800 firms.
To move from system-level properties to historical processes at the level of firms ...
For historical network analysis • Network analysis: topology • Historical analysis: temporality • Synthesis: find structures in social space and social times • Methodological innovation: Sequence analysis of network positions to identify pathways through local network topologies • From time as avariable to time as variable
Probe for differences in types of embeddedness • Different local network topographic properties reflect different organizing practices • Firms can use network properties, for example, to hide assets, to restructure assets, to gain access to knowledge, to increase legitimation, to secure access to supplies and markets, and so on
Structure as topology and temporality Studying variation in the sequences of local structures is a way to identify distinctive pathways of network evolution
1989 1990 1991
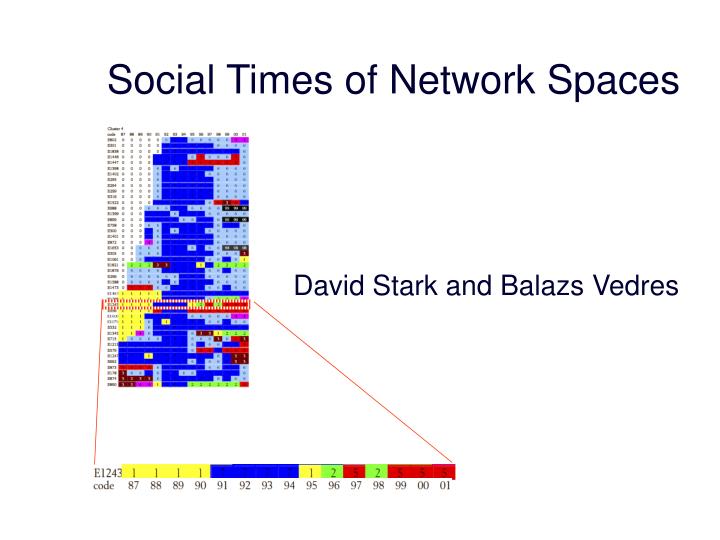
Name Color Graph 1. Isolate 2. Dyad component member 3. Small star periphery 4. Large star periphery 5. Star center 6. Member of a cohesive group 7. Member of a strongly cohesive group
Finding sequential equivalence From 1,696 firm histories we need to find similar sequences. We use optimal matching analysis to find the distance of each sequence from all others.
To the resulting matrix we then apply hierarchical clustering that groups sequences so that within-cluster distances are as low as possible and between-cluster distances are high.
The combination of these two algorithms, yields – not unlike the concept of structural equivalence in network analysis – sequential equivalence.