Download
1 / 4
40 likes | 122 Views
ZoomCharts is proud to have been named among the best data visualization providers by Japanese technology website, nikkei BPnet. One of ZoomCharts’ interactive data charts was featured on nikkei BPnet, a major Japanese portal website geared towards business professionals and renowned as a trusted source of information that covers topics such as business, finance and government, with a large percentage of its users being in business management. nikkei BPnet is the go to place for news and insightful analysis on the newest technologies and trends in business and IT. Their experts and insiders cover subjects like social media, UX/UI, Big Data, development, and the Internet of Things (IoT), showcase the latest products from brands such as Logitech, Samsung, Sony, Lenovo, Microsoft, Apple, and Dell, review tools such as apps, tablets, notebooks, and smart phones, and add value to ongoing debates on subjects such as PC vs Mac, and Android vs iPhone. Consistently staying on top of the latest innovative technological ideas, nikkei BPnet is one of the best sources of information that knowledgeable professionals turn to for the first look at what’s big and upcoming in the world of technology ZoomCharts is being discovered as a top contender in data visualization, on an increasingly broader, worldwide scale. Be among the growing number of professionals uncovering the exciting potential that ZoomCharts opens up for analyzing and presenting data. ZoomCharts http://www.zoomcharts.com The world’s most interactive data visualization software

E N D
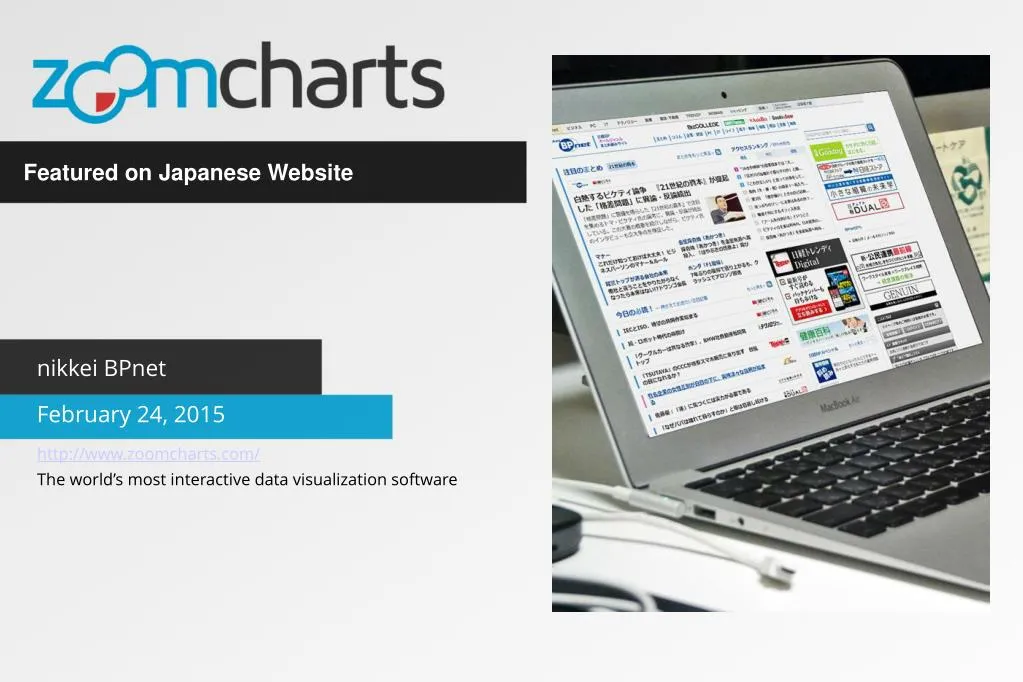
Featured on Japanese Website nikkei BPnet February 24, 2015 http://www.zoomcharts.com/ The world’s most interactive data visualization software
ZoomCharts Featured on Japanese Website nikkei BPnet ZoomCharts is proud to have been named among the best data visualization providers by Japanese technology website, nikkei BPnet. One of ZoomCharts’ interactive data charts was featured on nikkei BPnet, a major Japanese portal website geared towards business professionals and renowned as a trusted source of information that covers topics such as business, finance and government, with a large percentage of its users being in business management. nikkei BPnet is the go to place for news and insightful analysis on the newest technologies and trends in business and IT. Their experts and insiders cover subjects like social media, UX/UI, Big Data, development, and the Internet of Things (IoT), showcase the latest products from brands such as Logitech, Samsung, Sony, Lenovo, Microsoft, Apple, and Dell, review tools such as apps, tablets, notebooks, and smart phones, and add value to ongoing debates on subjects such as PC vs Mac, and Android vs iPhone. Consistently staying on top of the latest innovative technological ideas, nikkei BPnet is one of the best sources of information that knowledgeable professionals turn to for the first look at what’s big and upcoming in the world of technology ZoomCharts is being discovered as a top contender in data visualization, on an increasingly broader, worldwide scale. Be among the growing number of professionals uncovering the exciting potential that ZoomCharts opens up for analyzing and presenting data.
Check out ZoomCharts products: Network Chart Big network exploration Explore linked data sets. Highlight relevant data with dynamic filters and visual styles. Incremental data loading. Exploration with focus nodes. Time Chart Time navigation and exploration tool Browse activity logs, select time ranges. Multiple data series and value axes. Switch between time units. Pie Chart Amazingly intuitive hierarchical data exploration Get quick overview of your data and drill down when necessary. All in a single easy to use chart. Facet Chart Scrollable bar chart with drill-down Compare values side by side and provide easy access to the long tail. ZoomCharts http://www.zoomcharts.com/ The world’s most interactive data visualization software