Download
1 / 32
320 likes | 493 Views
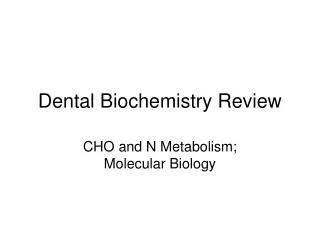
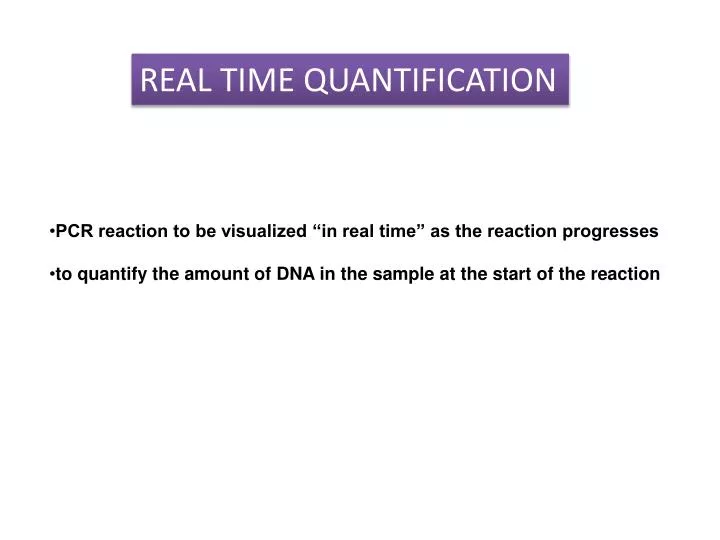
REAL TIME QUANTIFICATION. PCR reaction to be visualized “in real time” as the reaction progresses to quantify the amount of DNA in the sample at the start of the reaction. 5’. 3’. 5’. 3’. 3’. 3’. 3’. 3’. 3’. 3’. 5’. 5’. 5’. 5’. 5’. 5’. 5’. 5’. 5’. 5’. 5’. 5’. 3’. 3’. 3’.

E N D
REAL TIME QUANTIFICATION • PCR reaction to be visualized “in real time” as the reaction progresses • to quantify the amount of DNA in the sample at the start of the reaction
5’ 3’ 5’ 3’ 3’ 3’ 3’ 3’ 3’ 3’ 5’ 5’ 5’ 5’ 5’ 5’ 5’ 5’ 5’ 5’ 5’ 5’ 3’ 3’ 3’ 3’ 3’ 3’ 5’ 3’ 5’ 3’ THE REACTION d.NTPs Primers Thermal Stable DNA Polymerase Add to Reaction Tube Denaturation Annealing
5’ 5’ 5’ 3’ 3’ 3’ 5’ 5’ 3’ 3’ 3’ 3’ 5’ 5’ 3’ Taq Taq 5’ 5’ 5’ Taq Taq 5’ Extension Extension Continued Repeat
3’ 3’ 5’ 5’ 5’ 3’ 3’ 3’ 5’ 3’ 5’ 3’ 3’ 3’ 3’ 3’ 3’ 3’ 5’ 5’ 5’ 5’ 5’ 5’ 5’ 3’ 3’ 3’ 3’ 3’ 3’ 3’ 5’ 5’ 5’ 5’ 5’ 5’ 5’ 5’ 5’ 3’ 3’ 3’ 3’ 5’ 5’ 5’ Cycle 2 4 Copies Cycle 3 8 Copies
2*10=1024 4*5=1024
Ct values are directly related to the starting quantity of DNA, by way of the formula: Quantity = 2^Ct
Ct Values: 25 23 28
As shown by Higuchi et al.2, a plot of the log of initial target copy number for a set of standards versus CT is a straight line.
Effect of Limiting Reagents the rate of target amplification decreases until a plateau is reached CT is a more reliable measure of starting copy number than an endpoint measurement
Detection of PCR product accumulation double stranded DNA binding dye: SYBR GREEN ® fluorogenic probes: Taqman ® Probes
5’ 5’ 5’ 3’ 3’ 3’ 5’ 5’ 3’ 3’ 3’ 3’ 5’ 5’ 3’ Taq Taq 5’ 5’ 5’ Taq Taq l l l ID ID ID ID ID ID ID ID ID ID 5’ l l SYBR Green real time Extension Apply Excitation Wavelength Repeat
INTERNAL REFERENCE DYE 5700 system: able to use an internal reference dye (ROX) normalize for non-PCR-related, well-to-well fluctuations in fluorescence fluorescence readings taken at 95 ºC in the baseline region and is essential for reproducible results.
PROBE BASED real time fluorophore covalently attached to the 5’-end of the oligonucleotide probe and a quencher at the 3’-end. Fluorophores: 6-carboxyfluorescein, acronym: FAM, tetrachlorofluorescein, acronym: TET Quenchers: tetramethylrhodamine, acronym: TAMRA, minor groove binder, MGB
the 5' to 3' exonuclease activity of the polymerase degrades the probe that has annealed to the template. Degradation of the probe releases the fluorophore from it and breaks the close proximity to the quencher, thus relieving the quenching effect and allowing fluorescence of the fluorophore. Hence, fluorescence detected in the quantitative PCR thermal cycler is directly proportional to the fluorophore released and the amount of DNA
1. Template preparation and quality • Purity of nucleic acid templates is particularly important for real-time PCR, since contaminants can interfere with fluorescence detection. more sensitive to impurities such as proteins, phenol/chloroform, salts, and EDTA • removal of genomic DNA 2. Determining concentration and purity of nucleic acids
3. Storage of DNA and RNA • kits, no degradation is detectable for at least 1 year • Purified RNA should be stored at -20°C or -70°C in RNase-free water, under slightly basic conditions (e.g., Tris•Cl, pH 8.0) acidic conditions can cause hydrolysis of DNA. • Diluted solutions of nucleic acids (e.g., dilution series used as standards) should be stored in aliquots and thawed once only. • storage of aliquots in siliconized tubes where possible. This avoids adsorption of nucleic acids to the tube walls, which would reduce the concentration of nucleic acids in solution. For long-term storage of DNA samples, QIAsafe DNA Tubes and 96-Well Plates, which provide stable, room-temperature storage.
4. RT-PCR 1. Assay design • Automated • Self designed
2. One step vs two step RT-PCT • One-step RT-PCR combines the first-strand cDNA synthesis (reverse transcription) reaction and PCR reaction in the same tube, • easier processing of large numbers of samples, • and helps minimize carryover contamination, since tubes are not opened between cDNA synthesis and amplification. By amplifying the entire cDNA sample, one-step RT-PCR can provide greater sensitivity—from as little as 0.01 pg total RNA. • One-step reactions allow for the use of sequence-specific primers only. • Two-step PCR begins with the reverse transcription of either total RNA or poly(A)+ RNA into cDNA using a reverse transcriptase. • When performing two-step RT-PCR, you have the option of using either oligo(dT), random hexamer, or gene-specific primers, • then PCR is performed with either Platinum® Taq DNA Polymerase, Platinum® Taq DNA Polymerase High Fidelity, or your choice of PCR enzyme.
Two step RT-PCR QuantiTect SYBR® Green RT-PCR Kit QuantiTect Reverse Transcription Kit
CONTROLS 1. No template control (NTC) All quantification experiments should include an NTC, containing all the components of the reaction except for the template. This enables detection of contamination. 2. No RT control All RT-PCR experiments should include a negative control to test for contaminating DNA. 3. Positive control
ABSOLUTE AND RELATIVE QUANTIFICATION Absolute quantification • A standard curve (plot of CT value/crossing point against log of amount of standard) is generated using different dilutions of the standard. The target and each of the standards are amplified in separate tubes. The CT value of the target is compared with the standard curve, allowing calculation of the initial amount of the target. It is important to select an appropriate standard for the type of nucleic acid to be quantified.
Relative quantification With this method, the amounts of the target genes .... and the reference gene......house keeping gene The expression level of the reference gene must not vary under different experimental conditions, or in different states of the same tissue (e.g., "disease" versus "normal" samples). The quantification procedure differs depending on whether the target genes and the reference gene are amplified with comparable or different efficiencies. For determination of PCR efficiency,
The typical method to analyze real-time PCR data is the ΔΔCt method. Its mathematics assumes that the real-time PCR assay has a 100% amplification efficiency. As the primers deviate from this ideal, the error in the fold difference increases exponentially. The traditional method for determining amplification efficiency requires a calibration curve. Serially dilute an artificial template of known concentration. Plot the Ct values versus the initial amounts of input material on a semi-log10 plot, fit the data to a straight line (Fig) and calculate the slope. The closer the slope is to -3.33, the closer the amplification efficiency is to the 100% ideal.
To carry out melting curve analysis, the temperature is increased very slowly from a low temperature (e.g., 65°C) to a high temperature (e.g., 95°C). At low temperatures, all PCR products are double stranded, so SYBR Green I binds to them and fluorescence is high, whereas at high temperatures, PCR products are denatured, resulting in rapid decreases in fluorescence. The fluorescence is measured continuously as the temperature is increased and plotted against temperature. A curve is produced, because fluorescence decreases slightly through the lower end of the temperature range, but decreases much more rapidly at higher temperatures as the melting temperatures of nonspecific and specific PCR products are reached. The detection systems calculate the first derivatives of the curves, resulting in curves with peaks at the respective Tms. Curves with peaks at a Tm lower than that of the specific PCR product indicate the formation of primer-dimers, while diverse peaks with different Tms or plateaus indicate production of nonspecific products or a smear
Real-Time PCR has become a cornerstone of molecular biology: • Gene expression analysis • Cancer research • Drug research • Disease diagnosis • Viral quantification • Food testing • Percent GMO food • Transgenic research • Gene copy number TaqMan probe-based assays are widely used in quantitative PCR in research and medical laboratories: Gene expression assays Pharmacogenomics Human Leukocyte Antigen (HLA) genotyping Determine the viral load in clinical specimens (HIV, Hepatitis) Bacterial Identification[7] assays DNA quantification SNP genotyping Verification of microarray results