Download
1 / 6
60 likes | 69 Views
If you want to know how the real estate market statistics are updated in real-time then read this full PDF. In this PDF our expert explains in detail how the real estate market works. Follow for more. <br>

E N D
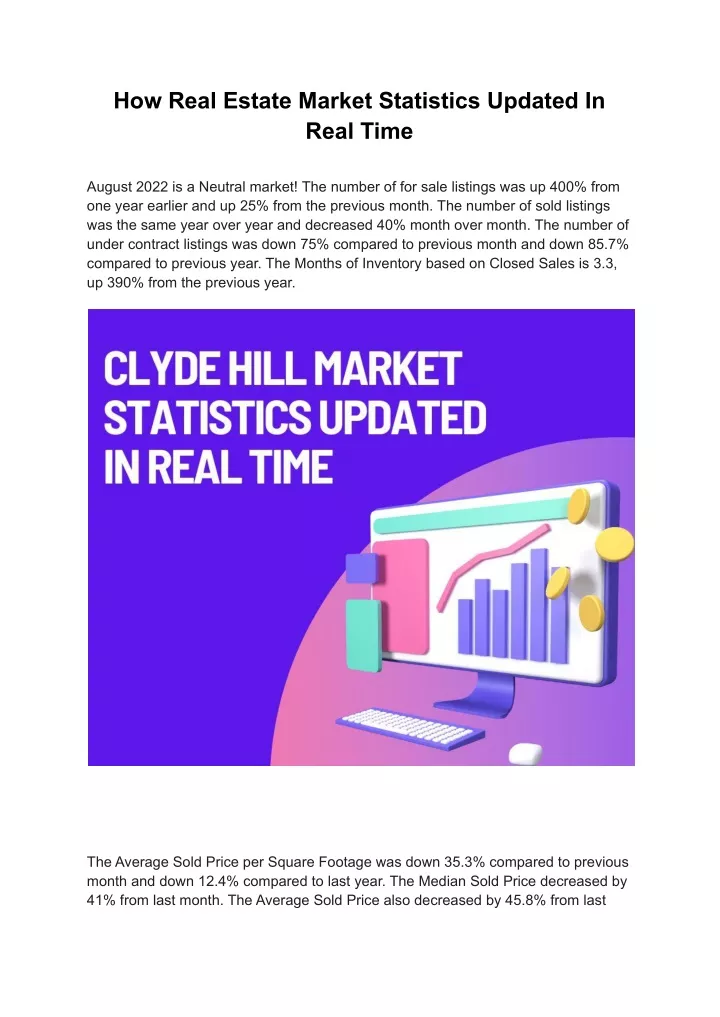
How Real Estate Market Statistics Updated In Real Time August 2022 is a Neutral market! The number of for sale listings was up 400% from one year earlier and up 25% from the previous month. The number of sold listings was the same year over year and decreased 40% month over month. The number of under contract listings was down 75% compared to previous month and down 85.7% compared to previous year. The Months of Inventory based on Closed Sales is 3.3, up 390% from the previous year. The Average Sold Price per Square Footage was down 35.3% compared to previous month and down 12.4% compared to last year. The Median Sold Price decreased by 41% from last month. The Average Sold Price also decreased by 45.8% from last
month. Based on the 6 month trend, the Average Sold Price trend is "Depreciating" and the Median Sold Price trend is "Depreciating". The Average Days on Clyde Hill WA Homes for Sale showed a neutral trend, an increase of 1,033.3% compared to previous year. The ratio of Sold Price vs. Original List Price is 86%, a decrease of 22.5% compared to previous year. Learn More - Schedule A No Obligation Strategy Call It is a Neutral Market Property Sales (Sold) August property sales were 3, the same as in August of 2021 and 40% lower than the 5 sales last month. Current Inventory (For Sale) Compared to last year, the total number of properties available this month is higher by 8 units or 400%. This year's bigger inventory means that buyers who waited to buy may have a bigger selection to choose from. The number of current inventory is up 25% compared to the previous month. Property under contract (Pended)
There was a decrease of 75% in the pending properties in August, with 1 property versus 4 last month. This month's pending property sales were 85.7% lower than at this time last year. All reports are published September 2022, based on data available at the end of August 2022, except for today's stats. Information and statistics derived from Northwest Multiple Listing Service. Neither the Board or its MLS guarantees or is in any way responsible for its accuracy. Data maintained by the Board or its MLS may not reflect all real estate activity in the market. Report reflects activity by all brokers participating in the MLS. Learn More - Schedule A No Obligation Strategy Call The Average Sold Price per Square Footage is Neutral* The Average Sold Price per Square Footage is a great indicator for the direction of property values. Since Median Sold Price and Average Sold Price can be impacted by the 'mix' of high or low end properties in the market, the Average Sold Price per Square Footage is a more normalised indicator on the direction of property values. The August 2022 Average Sold Price per Square Footage of $960 was down 35.3% from $1483 last month and down 12.4% from $1096 in August of last year. * Based on 6 month trend – Appreciating/Depreciating/Neutral
The Days on Market Shows Neutral Trend* The average Days on Market (DOM) shows how many days the average property is on the market before it sells. An upward trend in DOM trends to indicate a move towards more of a Buyer’s market, a downward trend indicates a move towards more of a Seller’s market. The DOM for August 2022 was 34, up 277.8% from 9 days last month and up 1,033.3% from 3 days in August of last year . The Sold/Original List Price Ratio is Falling** The Sold Price vs. Original List Price reveals the average amount that sellers are agreeing to come down from their original list price. The lower the ratio is below 100% the more of a Buyer’s market exists, a ratio at or above 100% indicates more of a Seller’s market. This month's Sold Price vs. Original List Price of 86% is down 14% % from last month and down from 22.5% % in August of last year. * Based on 6 month trend – Upward/Downward/Neutral ** Based on 6 month trend – Rising/Falling/Remains Steady All reports are published September 2022, based on data available at the end of August 2022, except for today's stats. Information and statistics derived from Northwest Multiple Listing Service. Neither the Board or its MLS guarantees or is in any way responsible for its accuracy. Data maintained by the Board or its MLS may not reflect all real estate activity in the market. Report reflects activity by all brokers participating in the MLS. Learn More - Schedule A No Obligation Strategy Call
The Average For Sale Price e is Neutral* The Average For Sale Price in August was $6,728,000, up 2.9% from $6,540,000 in August of 2021 and down 4.9% from $7,071,000 last month. The Average Sold Price is Depreciating* The Average Sold Price in August was $3,144,000, down 45.9% from $5,810,000 in August of 2021 and down 45.8% from $5,797,000 last month. The Median Sold Price is Depreciating* The Median Sold Price in August was $3,250,000, down 44.7% from $5,880,000 in August of 2021 and down 41% from $5,505,000 last month. * Based on 6 month trend – Appreciating/Depreciating/Neutral Learn More - Schedule A No Obligation Strategy Call It is a Neutral Market* A comparatively lower Months of Inventory is more beneficial for sellers while a higher months of inventory is better for buyers. *Buyer’s market: more than 6 months of inventory Seller’s market: less than 3 months of inventory Neutral market: 3 – 6 months of inventory Months of Inventory based on Closed Sales The August 2022 Months of Inventory based on Closed Sales of 3.3 was increased by 390% compared to last year and up 106.3% compared to last month. August 2022 is Neutral market. Months of Inventory based on Pended Sales The August 2022 Months of Inventory based on Pended Sales of 10 was increased by 3,395.1% compared to last year and up 400% compared to last month. August 2022 is Buyer's market.
All reports are published September 2022, based on data available at the end of August 2022, except for today's stats. Information and statistics derived from Northwest Multiple Listing Service. Neither the Board or its MLS guarantees or is in any way responsible for its accuracy. Data maintained by the Board or its MLS may not reflect all real estate activity in the market. Report reflects activity by all brokers participating in the MLS. Learn More - Schedule A No Obligation Strategy Call Absorption Rate measures the inverse of Months of Inventory and represents how much of the current active listings (as a percentage) are being absorbed each month. *Buyer’s market: 16.67% and below Seller’s market: 33.33% and above Neutral market: 16.67% - 33.33% Absorption Rate based on Closed Sales The August 2022 Absorption Rate based on Closed Sales of 30 was decreased by 80% compared to last year and down 52% compared to last month. Absorption Rate based on Pended Sales The August 2022 Absorption Rate based on Pended Sales of 10 was decreased by 97.1% compared to last year and down 80% compared to last month.