Download
1 / 37
370 likes | 900 Views
International Air Transport Consultancy. Air Service Issues at North Dakota EAS Communities. Presented to:. Presented by:. The North Dakota EAS Communities. David Dague. November 28, 2001. Post 9/11 Air Service Changes.

E N D
International Air Transport Consultancy Air ServiceIssues at North Dakota EAS Communities Presented to: Presented by: The North Dakota EAS Communities David Dague November 28, 2001
Post 9/11 Air Service Changes
Among the Major Carriers, United Airlines Had the Largest Service Decline and Southwest Had the Least % Change in Daily Scheduled Seats Pre September 11th vs. November 2001 Source: OAG Schedule Tapes
Midwest Express Leads the National Carriers in Post 9/11 Service Declines % Change in Daily Scheduled Seats Pre September 11th vs. November 2001 Source: OAG Schedule Tapes
The US Airline Industry Was in a Gradual State of Decline Before September 11th Change in Load Factors From Prior Year US Major Airlines Source: Carrier SEC Filings.
Even with the Federal Airline Bailout the Financial Results for the 3rd Qtr Were Disastrous Source: Airline SEC Fillings.
Large and Small Hub Airports Have Incurred Most of the Service Reductions Since 9/11 % Change in Daily Scheduled Seats From US Airports Pre September 11th vs. November 2001 Source: OAG Schedule Tapes.
The Reduction in Flying After September 11this Equivalent to Grounding 800 Jet Aircraft Source: OAG Schedule Tapes, USDOT, Form41
Nonstop Service Operated With Hushkitted Stage 3 Narrow Bodies Has Declined Significantly Since 9/11 % Change in Daily Departures by U.S Airlines Pre September 11th vs. November 2001 Source: OAG Schedule Tapes.
The Majority of Post 9/11 Service Reductions at Hub Airports Have Occurred in the Early Morning and Late Evening Hours Source: OAG Schedule Tapes
Mountain -15.7% Northeast -20.5% Central -14.4% Pacific -16.9% Great Lakes -15.6% Southeast -11.1% Southwest -12.6% Florida -9.2% The Northeast Region Had the Largest Decline in Capacity After 9/11 Source: OAG Schedule Tapes
-5.7% -17.5% -25.4% -18.1% -8.6% -11.8% -13.6% In the Central Region, North Dakota Had the Smallest Decline in Capacity Post 9/11 Change in Daily Seat DeparturesPre-September 11th vs. November 2001 Source: OAG Schedule Tapes
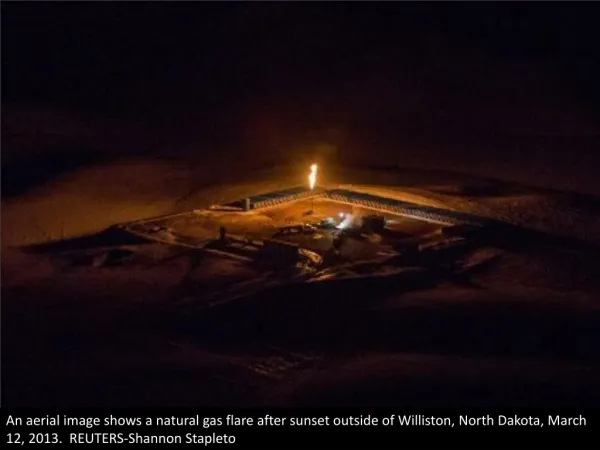
North Dakota's Post 9/11 Air Service Changes Source: OAG Schedule Tapes
United's Hubs are the Hardest Hit in Terms of Post 9/11 Service Reductions Source: OAG Schedule Tapes
Minneapolis Detroit Memphis Service Changes From Northwest Hubs Source: OAG Schedule Tapes
Chicago ORD San Francisco Washington IAD Denver Los Angeles Service Changes From United Hubs Source: OAG Schedule Tapes
Salt Lake City Cincinnati New York JFK Atlanta Dallas/Ft. Worth Orlando Service Changes From Delta Air Lines Hubs Source: OAG Schedule Tapes
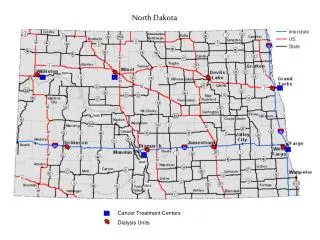
EAS Communities and North Dakota Air Service Issues
North Dakota’s Current Service Pattern Source: OAG Schedule Tapes, December 2001.
During September 2001, Most of the North Dakota Airports Performed Better than the National Average September Passenger Comparison of North Dakota Commercial Service Airports U.S. Average -33.4% Devils Lake Minot Fargo Bismarck Jamestown GrandForks Williston Dickinson TotalNorthDakota Source: Aeronautics Commission.
October 2001 Passenger Boardings Have Improved But Still Not Near Normal Levels October Passenger Comparison of North Dakota Commercial Service Airports U.S. Average -22.9% Devils Lake Minot Fargo Bismarck Jamestown GrandForks Williston Dickinson TotalNorthDakota Source: Aeronautics Commission.
Initial Analysis of Air Fares Offered in the State Shows Discouraging Results for the EAS Communities Phoenix Leisure Fares Source: SH&E and UND Fare Tracking Database.
Devils Lake Top 25 O&D Passenger Markets YE 2Q 2001 Source: USDOT, O&D Survey, via Database Products
Dickinson Top 25 O&D Passenger Markets YE 2Q 2001 Source: USDOT, O&D Survey, via Database Products
Jamestown Top 25 O&D Passenger Markets YE 2Q 2001 Source: USDOT, O&D Survey, via Database Products
Williston Top 25 O&D Passenger Markets YE 2Q 2001 Source: USDOT, O&D Survey, via Database Products
The Central Region is Devils Lake Largest Market Area, Accounting for Nearly Half of the Total Traffic Northeast 10.6% Great Lakes 7.6% Mountain 8.1% Pacific 9.7% Central 47.6% Southeast 4.8% Southwest 7.8% Florida 2.3% Source: USDOT, O&D Survey, via Database Products
Well Over Half of Dickinson’s Passenger TrafficIs Bound to the West Northeast 5.4% Great Lakes 4.1% Mountain 29.6% Pacific 32.2% Central 6.0% Southwest 17.7% Southeast 3.2% Florida 2.0% Source: USDOT, O&D Survey, via Database Products
The Central Region is Jamestown’s Lake Largest Market Area, Accounting for Over Half of the Total Traffic Northeast 6.2% Great Lakes 6.1% Mountain 10.2% Pacific 8.5% Central 58.9% Southeast 3.8% Southwest 5.2% Florida 1.1% Source: USDOT, O&D Survey, via Database Products
50% of Williston’s Passenger TrafficIs Bound to the West Great Lakes 5.4% Northeast 7.9% Mountain 26.2% Pacific 24.1% Central 5.6% Southeast 4.7% Southwest 23.2% Florida 2.8% Source: USDOT, O&D Survey, via Database Products
All of the EAS Communities Produce a Lower Percentage of Locally Generated Traffic Percentage of Locally Generated Traffic, YE 2Q 2001 State Average 54.6% Source: USDOT, O&D Survey, via Database Products
SH&E Has Been Hired to Perform the North Dakota Statewide Air Service Update • Analyze Air Fares • Airline Recovery • Feasibility of an Intra-State Network • Feasibility of Expanded Service From the Four Major Airports - BIS, FAR, GFK, MOT • Regional Jets • New Hub Services • Expand Existing Service • Essential Air Service Program Enhancements • Other Study Topics - Create Historic Databases, Role of Charters, Load Factors, Marketing Effectiveness
National Guard, High Yields Great Lakes Better than Nothing Great Lakes EAS Stability Professional Staff Funds Their Own Infrastruc Code Shares Travel Agents Federal Aid Guard has Negative Impact on JMS Service Cutbacks on Weekends Canceled Flights/Reliability Slow to Pay Aircraft Comfort Devils Lake Discussion Topics Negatives Positives
Frontier Connect, Term A Staff 3rd Roundtrip in the Works New Local Terminal Safe Federal Aid Fuel Sales Station Manager Number of Flights Fare Equity to Alternate Apts Travel Agent Education Aircraft Comfort Dickinson Discussion Topics Negatives Positives
Reasonable Air Fares Professional Staff Profitable Route Safe Federal Aid Lack of Cooperation to Increase Service Lack of Advertising NW Joint Fares Cheaper to Drive/Fly to FAR/BIS Small Plane Travel Agent Education Aircraft Comfort Jamestown Discussion Topics Negatives Positives
Frontier Connect Safe Economic Benefits to the Community Great Lakes Positive Attitude Big Sky - Competition Federal Aid Fuel Sales Shared Flights with DIK Reliability Aircraft Comfort Williston Discussion Topics Negatives Positives
General EAS Discussion Topics • Funding Levels Increased? • Can Someone Else Provide EAS Service Statewide • Big Sky • Mesaba • Alpine • Security Issues • Public Confidence in Turboprops • 30 Seat Prop Feasibility • Operating Incentive Measures