Download

1 / 25
250 likes | 703 Views
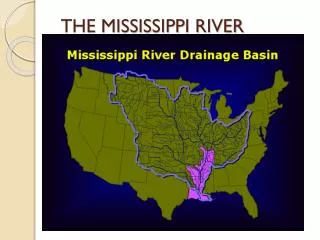
The NASQAN Program in the Mississippi River Basin. R.H. Coupe. NASQAN II Na tional S tream Q uality A ccounting N etwork. What Was NASQAN I?. Began in the early 70’s and continued through the mid 90’s Goal : to provide nationally comparable information on water quality

E N D
The NASQAN Program in the Mississippi River Basin R.H. Coupe
What Was NASQAN I? • Began in the early 70’s and continued through the mid 90’s • Goal : to provide nationally comparable information on water quality • At its peak extent, it included sampling at over 500 stations and was funded at $5 million annually
Was the Program Successful? Yes, the data has been used in a variety of ways: • To assess trends in water quality over time • Used extensively by States in their 305(b) assessments • To determine the flux of nutrients into the Gulf of Mexico and to determine sources areas for these nutrients within the Mississippi River Basin
What Happened to NASQAN I? • Program objectives could not be achieved with available funding • Inadequate QA/QC program • Constituents measured did not include important chemicals, such as pesticides and trace elements • Relation between NAWQA and NASQAN unclear
NAWQANational Water Quality Assessment • Begun in the early 90’s • Seeks to identify, explain, and determine status and trends in WQ conditions • Includes on a rotational basis >40 basins with a basin size of 10,000 to 100,000 square miles • Many original NASQAN stations were contained within NAWQA study units
Big Rivers • Mississippi River (1.2 million square miles) • The Great Lakes/St. Lawrence (396,000) • Rio Grande (336,000) • Yukon (328,000) • Columbia (258,000) • Colorado (250,000) • Next largest river 20% less than Colorado
NASQAN II Objectives • Provide an ongoing characterization of concentrations and flux of chemicals and sediment in the Nation’s largest rivers • Determine source areas for these materials • Assess the effect of human influences on the observed concentrations and flux
NASQAN Sample Collection • Sampling frequency varies among stations, normally 6 to 15 samples annually, with a possibility of more during extreme high flows. • The number of samples depends on the expected variability of water quality at the site. Since this is a flux based program, more samples are allocated during expected high flows.
NASQAN Samples Are: • Collected with appropriate equipment using standard and documented procedures • Depth and width integrated and velocity weighted • EDI or EWI with 3 to 10 verticals • Isokinetic samplers are used
Physical and Chemical Measurements Include: • Field parameters, T, SC, turb., DO, pH, alk. • Discharge • Suspended sediment and percent <63 um • Nutrients • Major ions • Trace elements – dissolved and SS • Pesticides – water soluble
PROCESSING : chamber used to prevent contamination. Here filtering for trace elements with 0.45 um capsule filter and masterflex pump with Teflon tubing.
Processing for pesticides using a 0.7 um nominal pore size baked glass fiber filter
All WRD Field Offices have something comparable to Montana’s mobile laboratory for processing in the field
Extensive QA Program • Well defined protocols for sampling, sample processing, chemical analysis and data review • QC program includes: • All field personnel participate in the NFQA program • Evaluation of quality control samples, including field blanks, replicates, and field-matrix spikes • On site inspections
Fluxes are computed using the rating curve method The rating curve equation f(Qi) has the form: ln(L) = ao + a1ln(Q) + a2ln(Q)2 + a3sin(t) + a4cos(t) + a5t
NASQAN Products • Data • Online as soon as it is received by District • Interpretative • Presentations at meetings and conferences • Special volume of Hydrological Processes • Yield maps just published online for 1995-98
2001 Mississippi State Soccer Champions, Division III, U14 Girls