Download
1 / 30
300 likes | 528 Views
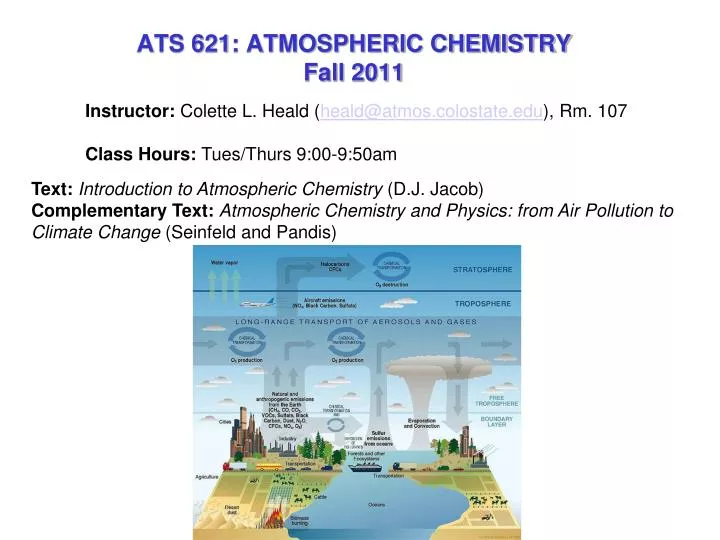
ATS 621: ATMOSPHERIC CHEMISTRY Fall 2011. Instructor: Colette L. Heald ( heald@atmos.colostate.edu ), Rm. 107 Class Hours: Tues/Thurs 9:00-9:50am. Text: Introduction to Atmospheric Chemistry (D.J. Jacob)

E N D
ATS 621: ATMOSPHERIC CHEMISTRYFall 2011 Instructor: Colette L. Heald (heald@atmos.colostate.edu), Rm. 107 Class Hours: Tues/Thurs 9:00-9:50am Text: Introduction to Atmospheric Chemistry (D.J. Jacob) Complementary Text: Atmospheric Chemistry and Physics: from Air Pollution to Climate Change (Seinfeld and Pandis)
IMPORTANCE OF ATMOSPHERIC CHEMISTRY Regional Air Pollution (…1950s…) Climate Change (…1990s…) Atmospheric CHEMISTRY Acid rain (1970s…) Stratospheric Ozone depletion (1985…)
URBAN/REGIONAL AIR POLLUTION 1948 – noontime (PA) Global air pollution LA Tropospheric ozone column: Jun-Aug
ACID RAIN 1989-1991 1997-1999 Getting better in the U.S. Wet sulfate deposition … but worsening in Asia Tropospheric ozone column: Jun-Aug
STRATOSPHERIC OZONE DEPLETION • Downward trends in stratospheric ozone column on a global scale Tropospheric ozone column: Jun-Aug
CLIMATE CHANGE Large increases in greenhouse gases and aerosols since pre-industrial times
IMPACTS OF ATMOSPHERIC CHEMISTRY GO BACK EVEN FURTHER…. Paintings by J.M.W. Turner show light scattering from volcanic aerosol Non-volcanic sunset (1828) Volcanic sunset (1833 Babuyan 1831) [Zerefos et al., 2007]
AIR QUALITY ALSO DICTATED HOW SOME CITIES EVOLVED… After the great fire of 1666, London’s most fashionable and wealthy districts were established in the West End. The mercantile classes moved East where the air quality was poor … even prior to the Industrial Revolution! Whitehall Docklands (eventually) St James Kensington Merchants/ industry Richard Blome’s map, 1673
WHAT IS THE ATMOSPHERE? • Gaesous envelope surrounding the Earth • Mixture of gases, also contains suspended solid and liquid particles (aerosols) • “Aerosol”= dispersed condensed phase suspended in a gas • We will use “species” as a generic term to describe a constituent of the atmosphere Aerosols are the “visible” components of the atmosphere Pollution haze over East Coast Dust off West Africa
BUT ATMOSPHERIC GASES ARE “VISIBLE” TOO…IF YOU LOOK IN THE UV OR IR NO2 Columns Observed from the SCIAMACHY Satellite Instrument
PREDICTING ATMOSPHERIC CONCENTRATION OF SPECIES X:solve mass balance (or “continuity”) equation for [X](x,t) deposition emission transport (flux divergence; U is wind vector) local change in concentration with time chemical production and loss (depends on concentrations of other species) [ ] is our general notation for concentration, but “concentration” is an ambiguous word – we will use three different measures: 1. Mixing ratio (or mole fraction) 2. Number density, mass concentration 3. Partial pressure
remains constant when air density changes e robust measure of atmospheric composition 1.1 Mixing ratio or mole fraction CX[mol mol-1] • Air also contains variable H2O vapor (10-6-10-2 mol mol-1) and aerosol particles • Trace gas concentration units: • 1 ppmv = 1x10⁻⁶ mol mol-1 • 1 ppbv = 1x10⁻⁹ mol mol-1 • 1 pptv = 1x10-12 mol mol-1 Trace gases
ATMOSPHERIC CO2 INCREASE OVER PAST 1000 YEARS Intergovernmental Panel on Climate Change (IPCC), 2005 Concentration units: parts per million (ppm) number of CO2 molecules per 106 molecules of air CO2 CONCENTRATION IS MEASURED AS MIXING RATIO
ATMOSPHERIC CO2 TREND OVER PAST 25 YEARS IPCC [2005] mmol mol-1 is the proper SI unit; ppm, ppmv are customary units
EPA SURFACE OZONE AIR QUALITY STANDARD “8-houraverage of 0.08 ppmv not to be exceeded more than 3x/year” EPA air quality standard for surface ozone is 75 ppb
"Perfect Gas" Law PV = N' kT or PV = N RT N' = number of molecules in the air parcel N = number of moles; N' = N x Av k = Boltzmann constant R = Universal Gas Constant; R = k x Av ================================= (In meteorology texts: P = r RT - different "R“ = 287 J/kg/K) k = 1.3806503 × 10⁻²³ m2 kg s-2 K-1 R = 8.31 J mole-1 K-1
1.2 Number density nX[molecules cm-3] • Proper measure for • reaction rates • optical properties of atmosphere Proper measure for absorption of radiation by atmosphere nXand CXare relatedby the ideal gas law: na = air density Av = Avogadro’s number P = pressure [Pa] R = Universal gas constant = Av k k=Boltzmann cnst T = temperature [K] MX= molecular weight of X [g/mol] Also define the mass concentration (g cm-3):
LAST WEEKEND’S STRATOSPHERIC OZONE LAYER http://jwocky.gsfc.nasa.gov/ Method: UV solar backscatter l1 l2 Ozone layer Scattering by Earth surface and atmosphere Ozone absorption spectrum 1 “Dobson Unit (DU)” = 0.01 mm ozone at STP = 2.69x10¹⁶ molecules cm-2 THICKNESS OF OZONE LAYER IS MEASURED AS A COLUMN CONCENTRATION l1 l2
ANNUAL MEAN PARTICULATE MATTER (PM) CONCENTRATIONS AT U.S. SITES, 1995-2000EPA particulate matter assessment document (NARSTO), 2003 PM2.5 (aerosol particles < 2.5 mm diameter) U.S. air quality standard: PM2.5 = 15 mg m-3 (annual mean) Red circles indicate sites in violation of the standard STANDARD IS EXPRESSED AS A MASS CONCENTRATION PER UNIT VOLUME
SPECIFIC ISSUES FOR AEROSOL CONCENTRATIONS • A given aerosol particle is characterized by its size, shape, phase, and chemical composition – large number of variables! • Measures of aerosol concentrations must be given in some integral form, by summing over all particles present in a given air volume that have a certain property • The aerosol size distribution must be treated as a continuous function URBAN Typical U.S. aerosol size distributions by volume RURAL
1.3 Partial pressure Px[Pa] Dalton’s law: Proper measure for phase change (such as condensation of water vapour) No lid: water molecules escape from pan to atmosphere (evaporation) Evaporation of liquid water from a pan: • Add a lid: • escaping water molecules collide on lid and return to surface; collision rate measures PH2O • eventually, flux escaping = flux returning : • saturation (PH2O,SAT) • cloud formation in atmosphere requires • PH2O > PH2O,SAT • T e PH2O,SAT
CLAUSIUS-CLAPEYRON EQUATION A = 6.11 hPa (= Pvap at 0C) B = 5310 K To = 273 K Vapour pressure increases sharply with temperature, due to the large latent heat. PH2O,SAT (hPa) T (K)
PHASE DIAGRAM FOR WATER Latest Observation for Fort Collins, CO (80523) triple point of water (n=0) gas-liquid metastable equilibrium Dew point: Temperature Tdsuch that PH2O = PH2O,SAT(Td)
due to accumulation of water vapor from volcanic outgassing early in its history RUNAWAY GREENHOUSE EFFECT ON VENUS …did not happen on Earth because farther from Sun; as water accumulated it reached saturation and precipitated, forming the oceans EARTH VENUS
WHY CAN YOU SEE YOUR BREATH ON COLD MORNINGS? Draw mixing lines (dashed) to describe dilution of your breath plume w/outside air PH2O is plotted on linear scale (vs. log on previous plots) to draw the mixing lines LIQ Your breath 37oC, ≈ 100%RH ICE warm outside air GAS cold outside air
RAOULT’S LAW solute molecules in green water saturation vapor pressure over pure liquid water surface water saturation vapor pressure over aqueous solution of water mixing ratio xH2O An atmosphere of relative humidity RH can contain at equilibrium aqueous solution particles of water mixing ratio
AIR POLLUTION HAZE Views of Acadia National Park http://www.hazecam.net/ “moderately polluted” day “clean” day Visibility is limited by high concentrations of aerosol particles that have swollen to large sizes due to high relative humidity
Cx nx Px CONVERTING BETWEEN DIFFERENT MEASURES OF CONCENTRATION