Download
1 / 25
250 likes | 489 Views
The Self Organizing Map (SOM) and Major League Baseball (MLB) Statistics. By: Clint Tomer MATH 3220. "Baseball, it is said, is only a game. True. And the Grand Canyon is only a hole in Arizona. Not all holes, or games, are created equal." -George F. Will. Outline.

E N D
The Self Organizing Map (SOM) and Major League Baseball (MLB) Statistics By: Clint Tomer MATH 3220
"Baseball, it is said, is only a game. True. And the Grand Canyon is only a hole in Arizona. Not all holes, or games, are created equal." -George F. Will Baseball Almanac
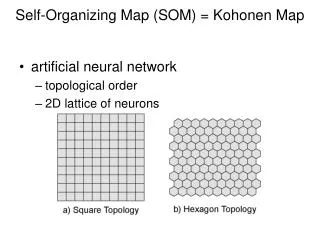
Outline • Introduction to the Self Organizing Map (SOM) • Dataset Overview • Description of the experiment
Outline Cont. • Hypothesized Results of Experiment • Actual Results of the Experiment • Experiment Conclusion • Summary
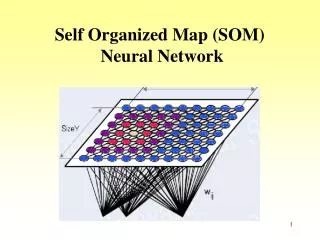
Introduction to Self Organizing Map (SOM) • Clustering Algorithm • Competitive Learning • Bubble and Gaussian Neighborhoods Borgelt
Clustering Algorithm • Groups the data • Do not have to have predefined classes • Groups are open for interpretation Cluster Analysis
Competitive Learning • Set of input vectors • SOM picks node with closest Euclidean Distance • Trains closest node and nodes around it • Thousands of iterations Wikipedia
Bubble and Gaussian Neighborhoods • Bubble neighborhood trains nodes around selected node equally • Gaussian neighborhood trains nodes more closer they are to the selected node McKee
Dataset Overview • MLB Stats • Looked at each year individually (2000-2006) • Took overall data for entire season • Key statistics in hitting, pitching, and fielding were used for experiment • Hitting – 16 different areas • Pitching - 10 • Fielding – 7 MLB Website
Description of Experiment • 4 Parts • Hitting stats • Pitching stats • Fielding stats • Hitting, Pitching, and Fielding stats combined
Description of Experiment cont. • For each part • Run statistical data through SOM • Arrange data on 15 x 15 grid • Analyze the data
Description of Experiment cont. • Check to see what grouped together • Playoff teams • Playoff contenders • Teams in last place • Divisions • World Series teams
Hypothesized Results of Experiment • Group playoff teams together • Group last place teams together
Actual Results • Results from • Pitching • Hitting • Fielding • All 3 combined together
Pitching Results • Grouped playoff teams together • 5 out of 7 experiments • 2000, 2001, 2002: Box around playoff teams • 2004, 2006: Playoff teams left & right corner MLB Website
Pitching Results Cont. • 2004 Pitching Results
Hitting Results • 2000: Box around playoff teams • 2002, 2004: Grouped World Series teams together • 2005: AL on left and NL on right MLB Website
Hitting Results Cont. • 2005 Hitting Results
Fielding Results • 2001, 2006: World Series teams together • 2003: World Series teams in opposite corners MLB Website
Fielding Results Cont. • 2003 Fielding Results
Pitching, Hitting, and Fielding Combined Results • 2000: “L” shape around playoff teams • 2002,2004: Separate teams that didn’t make the playoffs • 2001, 2002, 2004: World Series teams together • 2003: Top divisional teams together MLB Website
Pitching, Hitting, and Fielding Combined Results Cont. • 2003 Results
Experiment Conclusion • Grouped World Series teams 12/28 • Grouped playoff teams 9/28 • Pitching is important
Summary • SOM • Overview of data • Description of experiment • Experiment results
Sources • Cluster Analysis. (n.d.). Retrieved December 6, 2006 from http://www2.chass.ncsu.edu/garson/pa765/cluster.html • Self-Organizing Map. (n.d.). Retrieved December 6, 2006 from http://en.wikipedia.org/wiki/Self_organizing_map • Borgelt, Christian. (n.d.). Self-Organizing Map Training Visualization. Retrieved December 6, 2006 from http://fuzzy.cs.uni-magdeburg.de/~borgelt/doc/somd/ • McKee, Kevin. (n.d.). The Self-Organizing Map applied to 2005 NFL Quarterbacks. Retrieved December 6, 2006 from http://mercury.webster.edu/aleshunas/MATH%203220/MATH%203220%20Course%20Support%20Materials.html • Major League Baseball Website for Stats. (n.d.). Retrieved December 6, 2006 from http://mlb.mlb/NASApp/mlb/stats/sortable_team_stats.jsp?c_id=mlb • Major League Baseball Website for Playoff Teams. (n.d.) Retrieved December 6, 2006 from http://mlb.mlb/NASApp/mlb/mlb/schedule/ps_03,04,05,06.jsp • CBS Sportsline Website for Playoff Teams. (n.d.). Retrieved December 6, 2006 from http://cbs.sportsline.com/mlb/postseason/pastresults/ • Information on George F. Will. (n.d.). Retrieved December 10, 2006 from http://en.wikipedia.org/wiki/George_WIll • Heldt, S & Kreismer, J. Baseball Almanac. 2007. Saddle River, NJ