Download
1 / 30
300 likes | 544 Views
Key Concepts and Terminology. Apportionment: ReapportionmentMalapportionmentRedistrictingGerrymander. Apportionment. To divide up or allocate

E N D
1. Reapportionment and Redistricting in Idaho and the West Presented by the Political Science Department and the College of Social Sciences and Public Affairs
BOISE STATE UNIVERSITY
Workshop April 16 and 30, 2011
Idaho State Capitol
3. Apportionment To divide up or allocate �portions� on the basis of some specific criteria
While most representative bodies apportion on the basis of population, not all do so
The U.S. Senate is apportioned on the basis of political jurisdiction (i.e., state)
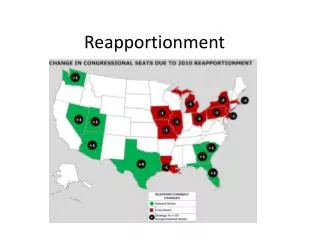
4. Reapportionment in US House 435 seats
All 50 states are guaranteed at least one seat in the US House
The remaining 385 seats are allocated on the basis of population
After the census, if one state gains a seat, another state loses a seat
7. Malapportionment
�Badly apportioned�-- unequal populations in congressional/legislative districts
Until the 1960s, the population deviation among districts in many states was very large
8. The Case of Illinois in the 1940s: The Under-representation of Chicago 51% of the state�s population resided in Chicago
But substantially fewer of the congressional districts were in Chicago
Illinois�s congressional district lines had not been altered since 1901.
? 7 �downstate� congressional districts had populations
under 200,000 each; the smallest was 112,000.
? One Chicago district had a population of 914,000 while another had a population of 625,000
Sources: Ansolabehere and Snyder, The End of Inequality and Charles Bullock III, Redistricting
9. Colegrove v. Green (1946) The U.S. Supreme Court essentially claimed it had no jurisdiction, because malapportionment required a �political remedy� that the Court could not provide.
Justice Felix Frankfurter,
�Courts ought not to enter this political thicket�
10. �The Reapportionment Revolution� ? Gomillion v. Lightfoot (1960)
? Baker v. Carr (1962)
Gray v. Sanders (1963)
Wesberry v. Sanders (1964)
Reynolds v. Sims (1964)
11. Key issues Justiciablility
Concern with vote discrimination against minorities
�one person, one vote� = equipopulus districts
No �federal analogy�: states cannot apportion a chamber on any basis other than population
Standards for equipopulous districts are different for congressional and state legislative districts
12. The 1960�sElecting a Majority in the House in Western States
13. Representation in Senates Article I, Section 3 US Constitution:
�The Senate of the United States shall be composed of
two Senators from each State�.�
26 states with the smallest populations control a majority of seats in the U.S. Senate.
In other words, 17% of the population elects 52% of the U.S. Senators
14. The State Senates
15. WHAT CONSTITUTES EQUIPOPULOUS DISTRICTS? CONGRESSIONAL DISTRICTS WITHIN A STATE MUST HAVE VIRTUALLY THE SAME NUMBER OF PEOPLE IN EACH DISTRICT
HISTORICALLY, STATES ARE AFFORDED SOME LEEWAY (UP TO 10% VARIATION) IN POPULATION BETWEEN STATE LEGISLATIVE DISTRICTS
16. DISTRICTING AND GERRYMANDERINGCREATE 5 DISTRICTS FROM14 ORANGE PRECINCTS, 11 BLUE PRECINCTS
17. Where do you find precinct data? County Clerk�s Office
Idaho Secretary of State website:
http://www.sos.idaho.gov/elect/results.htm
Election data, downloadable as excel files, to county or precinct level, all elections since 1990
18. 2010 precinct votes, District 16 Senate
19. Idaho Redistricting Commission --consists of 6 voting members, 3 chosen by Republican leadership, 3 chosen by Democratic leadership
--approval of a plan requires at least 4 votes
20. SOME PRINCIPLES BETWEEN 30 AND 35 DISTRICTS (ALMOST CERTAINLY WILL BE 35)
COUNTIES SHOULD NOT BE DIVIDED MORE THAN NECESSARY
IDEAL DISTRICT POPULATION IS POP=(TOTAL STATE POP/35)
PERMISSIBLE DEVIATION BETWEEN LARGEST AND SMALLEST DISTRICTS IS GENERALLY CONSIDERED TO BE 10%
21. Map idaho
22.
23. Idaho population growth Since the 2000 census, the state population grew 21 percent, to 1.57 million. That�s the 4th highest growth rate in the US.
This means the average district needs to grow from 37,000 in 2000 to almost 45,000.
24. Growth is uneven State growth between 2000 and 2010 was 273,000
92,000 in Ada County
57,000 in Canyon County
30,000 in Kootenai County
22,000 in Bonneville County
73% of the growth is in these 4 counties; over half the growth is in Ada and Canyon
25. At least 7 counties LOST population Bear Lake
Butte
Caribou
Clark
Clearwater
Minidoka
Shoshone
26. Population of current legislative districts
Ideal Population= 44,788
�Acceptable� range= 42,548 to 47,024
Current Range= 34,066 to 76,940
27. Regional notes Districts 1-9
Six districts are BELOW the acceptable MINIMUM
Three districts are within the acceptable range
None are ABOVE the acceptable MAXIMUM
28. Canyon County Districts 10-13
all four districts are above the ideal population, and three are above the maximum
District 13=58,725
29. Ada County Boise=districts 15-19 (includes G.C. in 16)
all five districts are BELOW the minimum
15=40,177
16=36,855
17=37,314
18=39,282
19=40,219
30. Ada County But the rest of Ada County (Kuna, Meridian, Star, unincorporated SW county area)
District 14=76,940
District 20=50,201
District 21=71,377
31. South Central(Mt. Home, Magic and Sun Valleys) Districts 22-27
None are above the maximum, some are within range, but a few are well below
Especially Districts 22 (34,066) and 27 (38,757)
32. Eastern Idaho Districts 28-35
2 districts above the maximum, 3 districts below the minimum, 3 within range
So, some shifting of lines, especially in Idaho Falls area, but nothing as dramatic as elsewhere