Download
1 / 58
680 likes | 1.88k Views
Point estimation and interval estimation. learning objectives: to understand the relationship between point estimation and interval estimation to calculate and interpret the confidence interval. Statistical estimation. Every member of the population has the same chance of being

E N D
Point estimation and interval estimation learning objectives: • to understandthe relationship between point estimation and interval estimation • to calculate and interpret the confidence interval
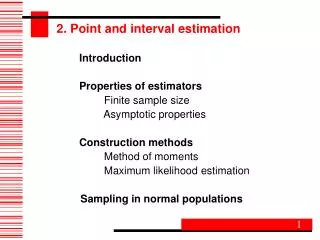
Statistical estimation Every member of the population has the same chance of being selected in the sample Population Parameters Random sample estimation Statistics
Statistical estimation Estimate Interval estimate Point estimate confidence interval for mean confidence interval for proportion sample mean sample proportion Point estimate is always within the interval estimate
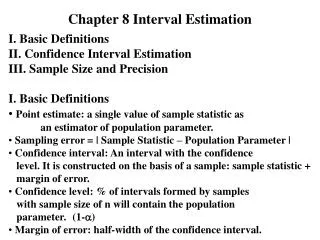
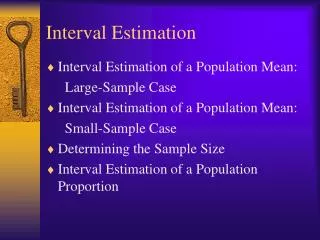
Interval estimationConfidence interval (CI) provide us with a range of values that we belive, with a given level of confidence, containes a true value CI for the poipulation means
Interval estimationConfidence interval (CI) 34% 34% 14% 14% 2% 2% z -3.0 -2.0 -1.0 0.0 1.0 2.0 3.0 2.58 -1.96 1.96 -2.58
50 40 30 Frequency 20 10 0 22.5 27.5 32.5 37.5 42.5 47.5 52.5 57.5 25.0 30.0 35.0 40.0 45.0 50.0 55.0 60.0 Age in years Interval estimationConfidence interval (CI), interpretation and example x= 41.0, SD= 8.7, SEM=0.46, 95% CI (40.0, 42), 99%CI (39.7, 42.1)
Testing of hypotheses learning objectives: • to understandthe role of significance test • to distinguish the null and alternative hypotheses • to interpret p-value, type I and II errors
Statistical inference. Role of chance. Formulate hypotheses Collect data to test hypotheses
Statistical inference. Role of chance. Systematic error Formulate hypotheses Collect data to test hypotheses C H A N C E Accept hypothesis Reject hypothesis Random error (chance) can be controlled by statistical significance or by confidence interval
Testing of hypothesesSignificance test Subjects: random sample of 352 nurses from HUS surgical hospitals Mean age of the nurses (based on sample): 41.0 Another random sample gave mean value: 42.0. Is it possible that the “true” age of nurses from HUS surgical hospitals was 41 years and observed mean ages differed just because of sampling error? Question: Answer can be given based on Significance Testing.
Testing of hypotheses Null hypothesis H0 - there is no difference Alternative hypothesis HA- question explored by the investigator Statistical method are used to test hypotheses The null hypothesis is the basis for statistical test.
Testing of hypothesesExample The purpose of the study: to assess the effect of the lactation nurse on attitudes towards breast feeding among women Research question: Does the lactation nurse have an effect on attitudes towards breast feeding ? The lactation nurse has an effect on attitudes towards breast feeding. HA : The lactation nurse has no effect on attitudes towards breast feeding. H0 :
Testing of hypothesesDefinition of p-value. 95% 2.5% 2.5% If our observed age value lies outside the green lines, the probability of getting a value as extreme as this if the null hypothesis is true is < 5%
Testing of hypothesesDefinition of p-value. p-value = probability of observing a value more extreme that actual value observed, if the null hypothesis is true The smaller the p-value, the more unlikely the null hypothesis seems an explanation for the data Interpretation for the example If results falls outside green lines, p<0.05, if it falls inside green lines, p>0.05
Testing of hypothesesType I and Type II Errors No study is perfect, there is always the chance for error -level of significance 1- -power of the test
Testing of hypothesesType I and Type II Errors there is only 5 chance in 100 that the result termed "significant" could occur by chance alone The probability of making a Type I (α) can be decreased by altering the level of significance. α =0.05 it will be more difficult to find a significant result the power of the test will be decreased the risk of a Type II error will be increased
Testing of hypothesesType I and Type II Errors The probability of making a Type II () can be decreased by increasing the level of significance. it will increase the chance of a Type I error To which type of error you are willing to risk ?
Testing of hypothesesType I and Type II Errors. Example Suppose there is a test for a particular disease. If the disease really exists and is diagnosed early, it can be successfully treated If it is notdiagnosed and treated, the person will become severely disabled If a person is erroneously diagnosed as having the disease and treated, no physical damage is done. To which type of error you are willing to risk ?
Testing of hypothesesType I and Type II Errors. Example. irreparable damage would be done treated but not harmed by the treatment Decision: to avoid Type error II, have high level of significance
Testing of hypothesesConfidence interval and significance test Null hypothesis is accepted A value for null hypothesis within the 95% CI p-value > 0.05 Null hypothesis is rejected A value for null hypothesis outside of 95% CI p-value < 0.05
Parametric and nonparametric tests of significance learning objectives: • to distinguish parametric and nonparametric tests of significance • to identify situations in which the use of parametric tests is appropriate • to identify situations in which the use of nonparametric tests is appropriate
Parametric and nonparametric tests of significance Parametric test of significance - to estimate at least one population parameter from sample statistics Assumption: the variable we have measured in the sample is normally distributed in the population to which we plan to generalize our findings Nonparametric test - distribution free, no assumption about the distribution of the variable in the population
Some concepts related to the statistical methods. Multiple comparison two or more data sets, which should be analyzed • repeated measurements made on the same individuals • entirely independent samples
Some concepts related to the statistical methods. Sample size number of cases, on which data have been obtained Which of the basic characteristics of a distribution are more sensitive to the sample size ? mean central tendency (mean, median, mode) variability (standard deviation, range, IQR) skewness kurtosis standard deviation skewness kurtosis
Some concepts related to the statistical methods. Degrees of freedom the number of scores, items, or other units in the data set, which are free to vary One- and two tailed tests one-tailed test of significance used for directional hypothesis two-tailed tests in all other situations
Selected nonparametric tests Chi-Square goodness of fit test. to determine whether a variable has a frequency distribution compariable to the one expected expected frequency can be based on • theory • previous experience • comparison groups
Selected nonparametric tests Chi-Square goodness of fit test. Example The average prognosis of total hip replacement in relation to pain reduction in hip joint is exelent - 80% good - 10% medium - 5% bad - 5% In our study of we had got a different outcome exelent - 95% good - 2% medium - 2% bad - 1% expected observed Does observed frequencies differ from expected ?
Selected nonparametric tests Chi-Square goodness of fit test. Example fe1= 80, fe2= 10, fe3=5, fe4= 5; fo1= 95, fo2= 2, fo3=2, fo4= 1; 2 > 3.841 p < 0.05 2 > 6.635 p < 0.01 2 > 10.83 p < 0.001 2= 14.2, df=3 (4-1) 0.0005 < p < 0.05 Null hypothesis is rejected at 5% level
Selected nonparametric tests Chi-Square test. Chi-square statistic (test) is usually used with an R (row) by C (column) table. Expected frequencies can be calculated: then df = (fr-1) (fc-1)
Selected nonparametric tests Chi-Square test. Example Question: whether men are treated more aggressively for cardiovascular problems than women? Sample: people have similar results on initial testing Response: whether or not a cardiac catheterization was recommended Independent: sex of the patient
Selected nonparametric tests Chi-Square test. Example Result: observed frequencies
Selected nonparametric tests Chi-Square test. Example Result: expected frequencies
Selected nonparametric tests Chi-Square test. Example Result: 2= 2.52, df=1 (2-1) (2-1) p > 0.05 Null hypothesis is accepted at 5% level Conclusion: Recommendation for cardiac catheterization is not related to the sex of the patient
Selected nonparametric tests Chi-Square test. Underlying assumptions. Cannot be used to analyze differences in scores or their means • Frequency data • Adequate sample size Expected frequencies should not be less than 5 • Measures independent of each other No subjects can be count more than once • Theoretical basis for the categorization of the variables Categories should be defined prior to data collection and analysis
Selected nonparametric tests Fisher’s exact test. McNemar test. • For N x N design and very small sample size Fisher's exact test should be applied • McNemar test can be used with two dichotomous measures on the same subjects (repeated measurements). It is used to measure change
Selected nonparametric tests Ordinal data independent groups. Mann-Whitney U : used to compare two groups Kruskal-Wallis H: used to compare two or more groups
Selected nonparametric tests Ordinal data independent groups. Mann-Whitney test Null hypothesis : Two sampled populations are equivalent in location The observations from both groups are combined and ranked, with the average rank assigned in the case of ties. If the populations are identical in location, the ranks should be randomly mixed between the two samples
Selected nonparametric tests Ordinal data independent groups. Kruskal-Wallis test k- groups comparison, k 2 Null hypothesis : k sampled populations are equivalent in location The observations from all groups are combined and ranked, with the average rank assigned in the case of ties. If the populations are identical in location, the ranks should be randomly mixed between the k samples
Selected nonparametric tests Ordinal data related groups. Wilcoxon matched-pairs signed rank test: used to compare two related groups Friedman matched samples: used to compare two or more related groups
Selected nonparametric tests Ordinal data 2 related groups Wilcoxon signed rank test Two related variables. No assumptions about the shape of distributions of the variables. Null hypothesis : Two variables have the same distribution Takes into account information about the magnitude of differences within pairs and gives more weight to pairs that show large differences than to pairs that show small differences. Based on the ranks of the absolute values of the differences between the two variables.
Selected parametric tests One group t-test. Example Comparison of sample mean with a population mean It is knownthat the weight of young adult male has a mean value of 70.0 kg with a standard deviation of 4.0 kg. Thus the population mean, µ= 70.0 and population standard deviation, σ= 4.0. Data from random sample of 28 males of similar ages but with specific enzyme defect:mean body weight of 67.0 kg and the sample standard deviation of 4.2 kg. Question: Whether the studed group have a significantly lower body weight than the general population?
Selected parametric tests One group t-test. Example population mean, µ= 70.0 population standard deviation, σ= 4.0. sample size = 28 sample mean, x = 67.0 sample standard deviation, s= 4.0. Null hypothesis: There is no difference between sample mean and population mean. t - statistic = 0.15, p >0.05 Null hypothesis is accepted at 5% level
Selected parametric tests Two unrelated group, t-test. Example Comparison of means from two unrelated groups Study of the effects of anticonvulsant therapy on bone disease in the elderly. Study design: Samples: group of treated patients (n=55) group of untreated patients (n=47) Outcome measure: serum calcium concentration Research question: Whether the groups statistically significantly differ in mean serum consentration? Test of significance: Pooled t-test
Selected parametric tests Two unrelated group, t-test. Example Comparison of means from two unrelated groups Study of the effects of anticonvulsant therapy on bone disease in the elderly. Study design: Samples: group of treated patients (n=20) group of untreated patients (n=27) Outcome measure: serum calcium concentration Research question: Whether the groups statistically significantly differ in mean serum consentration? Test of significance: Separate t-test
Selected parametric tests Two related group, paired t-test. Example Comparison of means from two related variabless Study of the effects of anticonvulsant therapy on bone disease in the elderly. Study design: Sample: group of treated patients (n=40) Outcome measure: serum calcium concentration before and after operation Research question: Whether the mean serum consentration statistically significantly differ before and after operation? Test of significance: paired t-test
Selected parametric tests k unrelated group, one -way ANOVA test. Example Comparison of means from k unrelated groups Study of the effects of two different drugs (A and B) on weight reduction. Study design: Samples: group of patients treated with drug A (n=32) group of patientstreated with drug B (n=35) control group (n=40) Outcome measure: weight reduction Research question: Whether the groups statistically significantly differ in mean weight reduction? Test of significance: one-way ANOVA test
Selected parametric tests k unrelated group, one -way ANOVA test. Example The group means compared with the overall mean of the sample Visual examination of the individual group means may yield no clear answer about which of the means are different Additionally post-hoc tests can be used (Scheffe or Bonferroni)