Download
1 / 27
280 likes | 339 Views
Nifty Trading Academy Review For Basic of Technical Analysis<br><br>For More Detail : http://niftytradingacademy.net/

E N D
Technical analysis-know how Nifty Trading Academy Review- 99253 91111
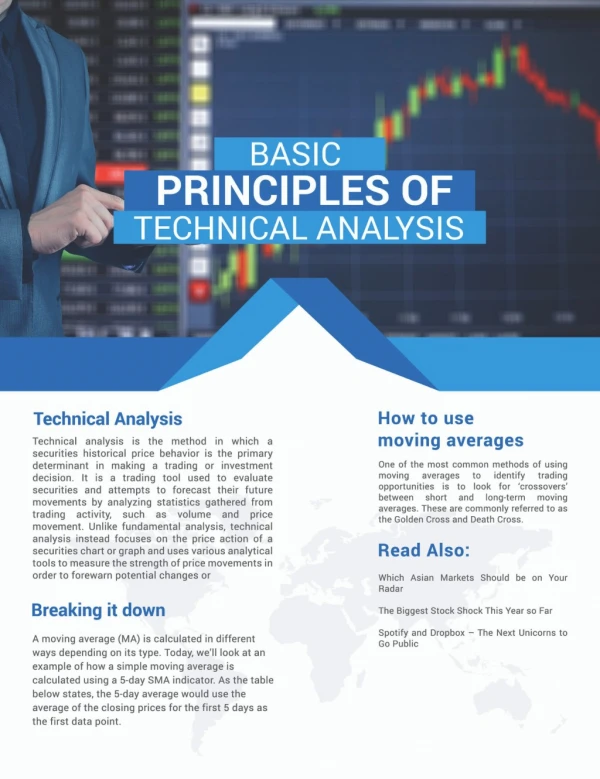
Basics of Technical Analysis • Technical analysis is used to forecast stock prices on the basis of market-derived • data. • Technicians (also known as quantitative analysts or chartists) usually stare at price, • volume and psychological indicators over time. • They look for trends and patterns in the data that indicate future price movements. http://www.niftytradingacademy.net/ 99253 91111
Why Technical Analysis • TA is useful with various Aspects and in Various ways • Trends for Coming Days. • Trends mean whether it is Up trend or Down Trend • TA is mostly used in West and Some Asian Countries like Japan for More than 125 to 150 Years Back. • In India, it is popular from last 20 to 25 years. http://www.niftytradingacademy.net/ 99253 91111
Fundamental vs. Technical • The Difference between TA and FA is that, FA finds the reasons for stock to move up/Down due to result. Whether TA is not concern with the reason. • In TA, sometimes reason may come afterward for stocks to move up or down. http://www.niftytradingacademy.net/ 99253 91111
The Logic of Technical Analysis • The logic behind Technical Analysis http://www.niftytradingacademy.net 99253 91111
Assumptions of Technical Analysis http://www.niftytradingacademy.net 99253 91111
Charts • Position http://www.niftytradingacademy.net 99253 91111
Line Chart Line charts are familiar to all types of analysts and are a simple graphic display of price trends over time. Usually, the chart is a plot of data points, such as share price, with a line connecting these points. http://www.niftytradingacademy.net 99253 91111
Bar Chart A bar chart, in contrast, has four bits of data in each entry—the high and low price encountered during the time interval plus the opening and closing prices http://www.niftytradingacademy.net 99253 91111
(*) Candel Stick Green Candle and Red candle. • There are four price in candle. • Open • High • Low • Close. If Open to close is high it is a green candle. If open to close Below it is a Red candle. http://www.niftytradingacademy.net 99253 91111
Candle Stick Charts • Candel Stick http://www.niftytradingacademy.net 99253 91111
Price and Volume http://www.niftytradingacademy.net 99253 91111
Trend Analysis http://www.niftytradingacademy.net 99253 91111
Support and Resistance http://www.niftytradingacademy.net 99253 91111
Chart Patterns http://www.niftytradingacademy.net 99253 91111
Types of Charts Construction of Charts:- There are two Axis 1. X-Axis and 2. Y-Axis. • X-Axis - Shows Time period of the Stocks. • Y-Axis – Shows Value of the Stocks. • Time Period Means:- Price can be plotted on the charts from Minute to year http://www.niftytradingacademy.net 99253 91111
Types of Charts • Types of Charts • Minute-to-Minute Charts. • Daily Charts. • Weekly Charts. • Monthly Charts. • Yearly Charts. http://www.niftytradingacademy.net 99253 91111
Types of Trends • Up Trend • Down Trend • Flat or Sideways Trend http://www.niftytradingacademy.net 99253 91111
Up trend • In Up Trend , stocks prices move in upward direction. • Formation is higher top and higher bottom. One should buy at every decline. http://www.niftytradingacademy.net 99253 91111
Up trend http://www.niftytradingacademy.net 99253 91111
Down Trend 2) Down Trend:- • In down trend, stocks prices move in downward direction. • Formation lower bottom and lower top. One should sell at every rise http://www.niftytradingacademy.net 99253 91111
Trend Analysis http://www.niftytradingacademy.net 99253 91111
Sideways Trend 3) Flat or Sideways Trends:- • In sideways trends, stocks prices move in narrow range neither going up wards nor down wards. • Here, one should have to wait for the clear trend whether up or down. http://www.niftytradingacademy.net 99253 91111
Technical Indicators http://www.niftytradingacademy.net 99253 91111
Price-Based Indicator: Moving Average http://www.niftytradingacademy.net 99253 91111
Price-Based Indicator: Bollinger Band http://www.niftytradingacademy.net 99253 91111
1st Indian Institute for LiveMarket Training http://www.niftytradingacademy.net THANK YOU ALL http://www.niftytradingacademy.net 99253 91111