Download
1 / 24
290 likes | 1.23k Views
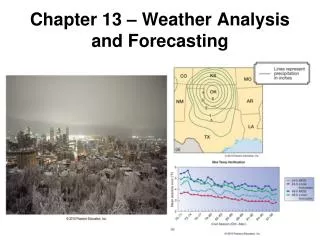
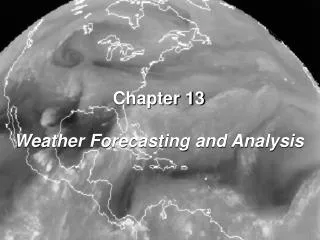
Weather Forecasting Chapter 13. Methods of Forecasting. Weather forecasting can be done using many different techniques: Folklore forecasts Persistence Climatology Trend forecast Analog forecasts Numerical forecasting Ensemble forecasting. Folklore Forecasts.

E N D
Methods of Forecasting • Weather forecasting can be done using many different techniques: • Folklore forecasts • Persistence • Climatology • Trend forecast • Analog forecasts • Numerical forecasting • Ensemble forecasting
Folklore Forecasts • Developed over time, often in the form of rhymes • Some are OK, others are quite bad • Famous example: “Red sky at night, sailor’s delight; Red sky at morning, sailor take warning.” • Groundhog Day is an excellent example of a terrible forecast!
Persistence Forecast • Quite simply, the weather we are having now will be the weather we have later • Accuracy will depend largely on the weather patterns and your location • Don’t use this if frequent changes in the weather are common (like Chicago) • Works best in the tropics • Works OK if the weather pattern is “blocked” (not much change in the weather possible for days or weeks)
Climatology Forecast • The long-term average weather conditions are used to predict the weather for a given day • While weather does change a lot, climatology can be accurate fairly often • Obviously won’t work well if one is facing record-setting weather conditions
Trend Forecast • The weather will change, but assumes that the weather-changing patterns will continue at the present rate • For example, one can forecast the arrival of a cold front using its present speed • Works best if the time period is short • “Nowcasting” – forecasting for a brief period in the future (several hours) • Accuracy drops as time increases
Analog Forecast • Basic premise: History repeats itself • Find examples of the past that match the current conditions • Then forecast whatever happened the next day in the historical case • Requires many years of weather maps and fast ways to compare them
Weather Types • Categorizing the weather into various “personalities” • Many examples are heard in the news: • “Nor-Easter”: Snow storm moving up the Atlantic coast, bringing heavy snow and strong winds to the East coast • “Alberta Clipper”: Fast-moving storm that usually just drops an inch or two of light snow • “Panhandle Hooker”: Storm that develops in the lee of the Rocky Mountains near the TX/OK panhandles, then curves towards the northeast later (usually gives us our big snow days)
Numerical Forecasting • Forecasting the weather using computers requires two basic ingredients to produce accurate forecasts: • Initial Conditions: The current conditions of the atmosphere over a wide area • Primitive Equations: Mathematical equations that can be solved by computer to forecast into time • Numerical modeling is the technique of approximating tough real-world problems with numbers • The numerical formulas used are called a model • This is impossible to use without supercomputers
Numerical Weather Prediction Process • Step 1: Weather Observations • Step 2: Data Assimilation • Step 3: Forecast Model Integration • Step 4: Forecast Tweaking and Broadcasting
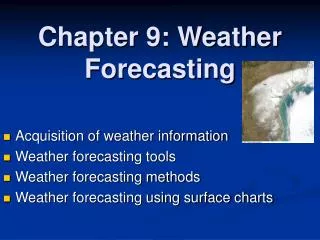
Weather Observations • A numerical forecast is only as accurate as the observations that go into the forecast at the beginning • Garbage in = Garbage out • Surface weather observations, radiosonde data, and satellites • Vast and continuous data-collection process is overseen by the World Meteorological Organization (WMO) • In the US, the National Centers for Environmental Prediction (NCEP) gets the data and runs the computer models
Grids and Gridpoints • Models work by dividing the atmosphere up into three-dimensional boxes called grids • The point in the middle is called the gridpoint • All the mathematical equations are solved at each gridpoint • Then, the model is stepped forward in time and the equations are run again • The distance between one point and another is called grid spacing • Models that use this technique are called gridpoint models
Data Assimilation & Initialization • Weather observations now must be inserted into each gridpoint • Because an actual observation probably doesn’t exist at every gridpoint, interpolation (fitting the data) must be performed • Data initialization: Filtering the data to remove noise and to make the data more smooth • The chore of interpolating and initializing the data is called data assimilation
Forecast Model Integration • Millions of calculations are performed at a given time • Integration – solving equations in space and time, then using the result to further calculate changes later on • To forecast 24 hours globally, it takes 1 trillion calculations • To get the results back quickly, supercomputers must be used • The physical distance between the gridpoints is very important • The smaller the grid spacing, the easier it is for the model to observe and predict small phenomena • Resolution – the grid spacing of a model (fine vs. coarse) • The more resolution, the more calculations must be performed in each time step
Numerical Models Today • Various numerical models are used today • Each model has a different resolution, different ways to handle things it can not see or predict, and different equations used in the computations • Therefore, models often differ with each other • Forecast “tweaking” and broadcasting of the forecast makes use of many different models, knowing their biases, to put a forecast together
What Makes Bad Forecasts? • Imperfect data • Compromises between gridspacing and speed of calculations • Improper parameterizations – crude approximations or “fudges” of actual phenomena that the model can’t resolve • Chaos – Sensitivity to initial conditions will drive a forecast model to react very differently with very subtle changes
Ensemble Forecasts • Confidence in a numerical model’s output can be gained by looking at ensemble forecasts • First, the forecast is calculated by the model • Then, the model is run again by changing some variables only slightly • This is done over and over again, changing the initial values every time • If the model still produces the same forecast, then the outcome can be judged as fairly certain • If the model produces widely different forecasts after each run, then a particular outcome is in doubt • “Spaghetti plots” = ensemble forecast • All output is displayed on the same image. If the output varies widely, a lot of lines will be all over the place
Current Results • Numerical weather prediction is getting better – the “Storm of the Century” in 1993 was handled well • There are still some bad forecasts too, however • There is a two-week limit in numerical forecasting before chaos sets in • 36-hour forecasts are quite accurate • 72-hour forecasts are as good as 36-hour forecasts were back in the mid-1970s