Download
1 / 85
850 likes | 1.29k Views
Figure 74-2: Schematic of body composition of a healthy subject. ... Diet shifts from one high in complex carbohydrates and fiber to a more varied diet higher in fats, saturated ...

E N D
Slide 1:Nutrition in Developing Countries
NUTR 555/HSERV 555
Reasons communities support healthy diets Chronologic age Physiologic age / Functional Health Quality of life Healthy children Political Stability Environmental Quality Economic Growth / Productivity Consider: What is your definition of malnutrition? Concept CheckSlide 4:Learning Objectives:
Provide an orientation to the socio-ecological model Identify nutrition elements in the segments of the model Review segments of the model related to dietary/ nutr assessment and needs Review the principles of nutrition for: Energy CHO Protein Fats Micronutrients Discuss malnutrition and transition diets.
Slide 5:Social Ecological Model
Health promotion approaches that are based on the social-ecological model focus on the behavior choices of each individual as well as situations within each sphere that can influence health behaviors. Gregson et al: J Nutr Ed 2001;33(Suppl 1): S4-15. Washington State Nutrition and Physical Activity Plan, 2004
Individual: awareness, knowledge, attitudes, beliefs, values, preferences Interpersonal: family, friends, peers that provide social identify and support Institutional/organizational: rules, polices, procedures, environment, informal structures Community: Social networks, norms standards and practices Public Policy: local, state, and federal government policies, regulations and laws. Washington State Nutrition and Physical Activity Plan, 2004 Individual Interpersonal Institutional/ Organizational Community Policies/ Systems / EnvironmentSlide 8:Learning Objectives:
Provide an orientation to the socio-ecological model Identify nutrition elements in the segments of the model Review segments of the model related to dietary/ nutr assessment and needs Review the principles of nutrition for: Energy CHO Protein Fats Micronutrients Discuss malnutrition and transition diets.
Slide 9:Progression of Elements of Basic Nutrition
Recommended Intakes of Nutrients and Energy Compared FAO: Energy and Protein Requirements; 2001: http://www.fao.org/docrep/003/AA040E/AA040E00.HTMSlide 12:Assessment of Individuals
Body Weight / Anthropometrics Energy expenditure Essential Nutrients
Basal metabolic rate 60 - 75% (Resting metabolic rate) Physical Activity 15 - 30% Diet Induced 7 - 13% Other 2 - 7% Elia M.: Energy expenditure in the whole body. IN: Energy Metabolism: Tissue Determinants and Cellular Corollaries, Eds. Kinney JM, Tucker HN, Raven Press Ltd., New York, 1992. Energy Assessment:Slide 14:How do we measure energy?
Food energy is measured in kilocalories (kcal). A kilocalorie is 1000 calories as used in scientific contexts. A kilocalorie is the amount of energy needed to heat 1000 cc (1 liter) of water one degree Celsius. When one hears the term �Calorie� in reference to food, it generally means a kilocalorie.
Slide 15:Conversion Factors for Energy
1 joule (J) is the amount of mechanical energy required to displace a mass of 1 kg through a distance of 1 m with an acceleration of 1 m per second (1 J = 1 kg � 1 m2 � 1 sec-2). Multiples of 1 000 (kilojoules, kJ) or 1 million (megajoules, MJ) are used in human nutrition. The conversion factors between joules and calories are: 1 kcal = 4.184 kJ, or conversely, 1 kJ = 0.239 kcal. FAO: Energy and Protein Requirements; 2001: http://www.fao.org/docrep/003/AA040E/AA040E00.HTM
FAO: Energy and Protein Requirements; 2001: http://www.fao.org/docrep/003/AA040E/AA040E00.HTM FAO: Energy and Protein Requirements; 2001: http://www.fao.org/docrep/003/AA040E/AA040E00.HTM Figure 74-2: Schematic of body composition of a healthy subject. Body cell mass (BCM) is shown by shading as a composite of intracellular water, glycogen, and protein. FFM, fat-free mass. From: Harrison�s Online Methods of Assessment: Energy Body Mass Index: Weight in kg / (Height in Meters)2 Removes height from the formula Evaluation of Body Weight Body Mass Index: WHO Standards < 16.0 PEM - Level III 16.0 - 16.9 PEM - Level II 17.0 - 18.4 PEM - Level I 18.5 - 24.9 Desirable 25.0 - 29.9 Overweight > 30.0 Obese > 40.0 Severely Obese Evaluation of Body Weight Limitations of these reference values Assumptions behind the reference tables Age Gender Race Evaluation of Body Weight What about Underweight? Methods of Assessment: Energy Somatic Protein Stores: Fat Free Mass Protein Stores - Lean body mass (LBM) Muscles Visceral Tissues Fluid Stores Fat Mass average for men 15% average for women 28% Body Composition Body Composition Chemicals Foods Nutrients Food Groups Food Patterns The Five Elements of our Diets Hydrogen, Oxygen (Water) Carbon (Organic vs. Inorganic) Nitrogen (Protein) Cobalt - cobalamine - B12 ChemicalsSlide 27:What are the six classes of nutrient?
Carbohydrates Lipids Proteins Vitamins Minerals Water Nutrients
Slide 28:What are the three functional categories?
Promote Growth and Development � Proteins, lipids, vitamins, minerals, water Energy � Carbohydrates, lipids, and protein. Regulate Body Processes � Proteins, lipids, vitamins, minerals, water
Slide 29:Which nutrients (and non-nutrients) provide energy?
The �Macronutrients�: Carbohydrates (sugar, starch) � 4 kcal/g Protein � 4 kcal/g Lipids (fats, oils, cholesterol) � 9 kcal/g Alcohol (not a nutrient) � 7 kcal/g
Slide 30:Carbohydrates Lipids Proteins Vitamins Minerals Water
Nutrients
Slide 31:Monosaccharides
Structure Glucose Fructose Galactose
Slide 32:Fructose
Metabolized to glucose in the liver Metabolized to glycogen Metabolized to lactic acid Found in fruit, honey, and high fructose corn syrup
Slide 33:Galactose
Usually bound with glucose (lactose) Converted to glucose in the liver Available fuel source
Slide 34:Complex carbohydrates
Oligosaccharides: raffinose & stachyose Polysaccharides: Starch & Glycogen Dietary fiber
Slide 35:Polysaccharides: Starch
3,000 or more monosaccharides bound together Starch--alpha glycosidic bond Amylose--straight chain polymer Amylopectin--highly branched polymer Modified food starch and gel formation
Slide 36:Dietary Fiber
Undigested plant food Beta glycosidic bond Insoluble fiber Cellulose, hemicellulose, lignin Not fermented by the bacteria in the colon Soluble fiber Gum, Pectin, Mucilage Fruit, vegetable, rice bran, psyllium seed
Slide 37:FAO Recommendations for CHO:
An optimum diet of at least 55% of total energy from a variety of carbohydrate sources for all ages except for children under the age of two. That the bulk of carbohydrate-containing foods consumed be those rich in non-starch polysaccharides and with a low glycemic index. Appropriately processed cereals, vegetables, legumes, and fruits are particularly good food choices. http://www.fao.org/docrep/W8079E/w8079e0c.htm#TopOfPage
Slide 38:Carbohydrates Lipids Proteins Vitamins Minerals Water
Nutrients
Slide 39:Saturation Refers to the Degree to which Every Possible Position on the Carbon Chain Is Occupied by Hydrogen Atoms
Unsaturated points are where hydrogen atoms are �missing� and replaced by double bonds between carbon atoms.
Slide 40:Dietary Fatty Acids Consist Of:
Short Chain = fewer than 6 carbons Medium Chain = 6 � 10 carbons Long Chain = 12 � 24 carbons Saturated = no double bonds Monounsaturated = 1 double bond Polyunsaturated = 2 or more double bonds
Slide 41:Food Triglycerides Contain a Variety of Fatty Acids
Monounsaturated fatty acids are abundant in olive, peanut, and canola oils. Omega-6 polyunsaturated fatty acids are abundant in safflower, corn, and sunflower oils. Omega-3 polyunsaturated fatty acids are most abundant in fish and seafood, nuts, and some vegetable oils. Saturated fatty acids are high in meats and tropical palm and coconut oils.
Slide 42:Unsaturated Fatty Acids Can Become:
Oxidized = addition of oxygen molecules to carbons at double bonds = rancidity Hydrogenated = converted back to saturated form by addition of hydrogen at high temperature and pressure Trans-fatty acids = by-product of hydrogenation where hydrogens are on opposite sides of double bonds
Slide 43:Why are oils hydrogenated?
Hydrogenation makes oils less prone to rancidity and makes them remain solid at higher temperatures. This is used primarily in the making of margarine, but partial hydrogenation also increases the shelf life of vegetable oils.
Slide 44:For most adults, dietary fat should supply at least 15 percent of their energy intake. Women of reproductive age should consume at least 20 percent of their energy from fat. Concerted efforts should be made to ensure adequate consumption of dietary fat among populations where less than 15 percent of the dietary energy supply is from fat. Fat should not be specifically restricted below the age of 2 years. The optimum diet should be gradually introduced beginning at 2 years of age.
FAO Recommendations for Fat: Adults http://www.fao.org/docrep/W8079E/w8079e0c.htm#TopOfPage
Slide 45:Carbohydrates Lipids Proteins Vitamins Minerals Water
Nutrients
Slide 46:Proteins are the Most Complex of all Organic Molecules
Proteins consist of long chains (polypeptides) of variable subunits called amino acids There are 20 different kinds of amino acids found in proteins, each with a unique chemical structure The 20 different amino acids are used like an alphabet to spell out the structure of particular proteins
Slide 47:Side Chains Provide Unique Chemical Properties to Amino Acids
Some side chains are attracted to water, while other lipid-like side chains are repelled by it Other side chains are repelled by or attracted to neighboring amino acids Some side chains form links with amino acids on other polypeptide chains These forces cause polypeptides to variously bend, twist, fold or coil
Slide 48:Essential Amino Acids
Some amino acids can be reassembled to make different amino acids � these are called non-essential Other amino acids are essential in the diet � they cannot be made by the human body There are nine essential amino acids in the human diet: histidine, leucine, lysine, methionine, phenylalanine, threonine, tryptophan and valine
Slide 49: Structure Movement Enzymes Hormones Transport Antibodies Energy Fluid and Acid/Base Balance
Functions of Proteins in Our Bodies
Slide 50:Nitrogen Balance
Zero Balance � Amount of Nitrogen Retained = Amount of Nitrogen Excreted Positive Balance � More Nitrogen Retained and Used to Make Proteins and Other Nitrogen Containing Compounds than Excreted (e.g. Growth) Negative Balance � Nitrogen Not Utilized to Make Protein, More Excreted than Retained (e.g. Starvation)
Slide 51:Extrapolate from Amounts Needed to Sustain Growth and/or from N Balance Studies Add 2 Standard Deviations (adequate to support needs of 97.5% of population) Add 10% for Digestibility Add 10% for Chemical Score (not in USA) Factor in Additional Needs for Pregnancy and Lactation
Steps Used in Setting Protein RDAs
Slide 52:What Happens When We Don�t Eat Enough Protein?
Slide 53:For adults the protein requirement per kg body weight is considered to be the same for both sexes at all ages and body weights within the acceptable range. The value accepted for the safe level of intake is 0.75 g per kg per day, in terms of proteins with the digestibility of milk or egg.
FAO Recommendations for Protein: http://www.fao.org/docrep/W8079E/w8079e0c.htm#TopOfPage
c At 0.75 g per kg of protein with the quality and digestibility of milk or egg.Slide 57:Carbohydrates Lipids Proteins Vitamins Minerals Water
Nutrients
How do we assess diet? Methods Food Records FFQ 24 Hr Recalls with 5 Pass Strengths / Limitations Diet Assessment Individual Interpersonal Institutional/ Organizational Community Policies/ Systems / Environment Examples of Interpersonal influences on food / nutrition _________ Describe cultural and social influences that impact food availability. Concept CheckSlide 61:Household Distribution of Food
The household is the basic unit for food consumption under most settings, and if there is sufficient food, individual members of the household can consume a diet with the recommended nutrient densities and meet their specific RNIs. However, appropriate food distribution within the family must be considered to ensure that children and women receive adequate food with high micronutrient density. Household food distribution must be considered when establishing general dietary guidelines and addressing the needs of vulnerable groups in the community. In addition, education detailing the appropriate storage and processing of foods to prevent micronutrient losses at the household level is important.
Consider: Are there good and bad foods? Concept Check Individual Interpersonal Institutional/ Organizational Community Policies/ Systems / Environment Examples of Institutional/ Organizational influences on food / nutrition _______________Slide 64:Causes of Hunger
Status of Women and Education Illiterate girls: may marry as early as 11 years of age may have seven children before 18 years of age Girls who go to school: marry later have an average of 50% fewer children spacing of births each additional year of school results in a 5-10% decrease in mortality among her children
Individual Interpersonal Institutional/ Organizational Community Policies/ Systems / Environment Examples of Community influences on food / nutrition _________Slide 66: Breads, Cereals and other Grains Vegetables Fruits Meat, Poultry, Fish & Alternates Milk, Cheese and Yogurt Fats, Sweets, & Alcoholic Beverages
Food Groups
Slide 67:FAO: CHO in Human Nutrition
Figure 3 - Energy from the dominant starch staples, 1990-1992
Figure 2 - Starchy staples providing the highest proportion of food energy, 1990-1992Slide 68:FAO: CHO in Human Nutrition
Individual Interpersonal Institutional/ Organizational Community Policies/ Systems / Environment Examples of Policies/ Systems/ Environment that influences food / nutrition __Slide 70:Other Policies
Existing: Breastfeeding Supplementation Potential other policies
Slide 71:Learning Objectives:
Provide an orientation to the socio-ecological model Identify nutrition elements in the segments of the model Review segments of the model related to dietary/ nutr assessment and needs Review the principles of nutrition for: Energy CHO Protein Fats Micronutrients Discuss malnutrition and transition diets.
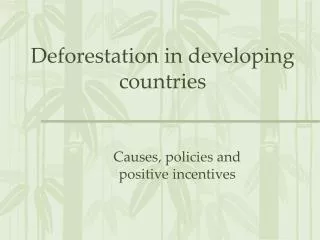
Slide 72:What is nutrition transition?
The shift in dietary pattern that occurs as incomes increase Diet shifts from one high in complex carbohydrates and fiber to a more varied diet higher in fats, saturated fat, and sugar
Slide 73:Nutrition Transition
Slide 74:The Two Faces of Malnutrition
Overnutrition A diet high in energy, saturated fat, cholesterol, and sodium, but low in fiber Cardiovascular disease Obesity Cancer Diabetes Osteoporosis Undernutrition A diet low in either energy or various specific nutrients Low birth weight Higher infant mortality rate Stunting Infectious disease
Slide 75:FAO: �The nutrition transition and obesity�
The underweight and overweight share: high levels of sickness and disability, shortened life spans and reduced productivity. Obesity increases the risk of chronic diseases such as diabetes, hypertension, heart disease, stroke, gall bladder disease and a number of cancers.
Slide 76:Obesity and income
In China, when per capita income grew fourfold after the economic reforms of the late 1970s, the consumption of high-fat foods soared. While incomes grew, the income needed to purchase a fatty diet decreased. In 1962, a diet containing 20 percent of total energy from fat correlated with a per capita GNP of US$1�475. By 1990, a GNP of just $750 correlated with the same diet.
http://www.fao.org/focus/e/obesity/obes1.htm .. http://www.fao.org/focus/e/obesity/obes1.htm Prevalence of Obesity in some Countries http://www.fao.org/focus/e/obesity/obes1.htm .. http://www.fao.org/focus/e/obesity/obes1.htmSlide 83:Obesity related Diabetes
The developing world risks suffering the lion's share of the growing disease burden. The number of people is expected to double to: 300 million between 1998 and 2025 75% (225 million)- projected in the developing world. For nations whose economic and social resources are already stretched to the limit, the result could be disastrous. FAO: �The nutrition transition and obesity�
What will health planners need to address the threat of obesity? Concept CheckSlide 85:Future Directions
Unfortunately, data from developing countries are limited. As a result, policy makers don't have what they need to evaluate the threat of increasing obesity and the rise of related chronic diseases. And the misconception that obesity is a problem afflicting only affluent countries may be holding back further research FAO: �The nutrition transition and obesity�