Download
1 / 52
520 likes | 852 Views
Determination and Examination of Norovirus Genotypes Circulating in Texas, 2009-2010. Cate Bowman Public Health Internship Program School of Biological Sciences The University of Texas at Austin Mentor: Aaron Benfield, PhD Molecular Biology Group Manager

E N D
Determination and Examination of Norovirus Genotypes Circulating in Texas, 2009-2010 Cate Bowman Public Health Internship Program School of Biological Sciences The University of Texas at Austin Mentor: Aaron Benfield, PhD Molecular Biology Group Manager Texas Department of State Health Services
Noroviruses • FamilyCaliciviridae • GenusNorovirus • Genogroups-GI,GII, GIV • Genoclusters - GII.4 • Subclusters: • Camberwell (1987) • Grimsby (1995) • Farmington Hills (2002) • Hunter (2004) • Minerva (2006) • Apeldoorn (2008)
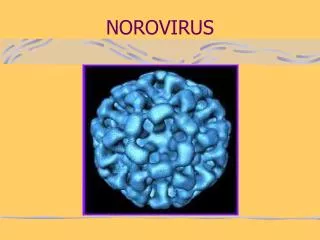
Characteristics • Non-enveloped • Icosahedral capsid symmetry • Positive-sense, single stranded RNA
Genome • Three open reading frames • ORF1 • Encodes non-structural proteins • ORF2 • Encodes VP1, major capsid protein • ORF3 • Encodes VP2, minor capsid protein ORF1 ORF2 ORF3
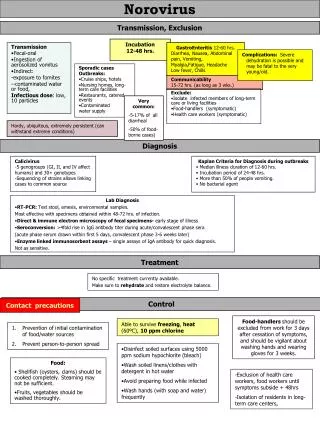
Entry into population • Infected food handlers • Most common food sources • Prepared foods • Fresh fruits and vegetables • Raw or undercooked seafood
Norovirus Prevalence • Most common cause of viral acute gastroenteritis • 21 million cases per year • 50% of foodborne disease outbreaks • 232 outbreaks from 1997-2002 CDC. 2010. MMWR. 59:975.
Epidemiology • At risk populations: • Prisons • Nursing homes • Schools • Cruise Ships
Infection • Transmission – fecal oral route • Infectious dose <10 particles • Incubation period - 24-48 hour incubation • Disease characteristics: • Self limiting - symptoms last 12-72 hours, up to 6 days • Symptoms: watery diarrhea, nausea, vomiting • Risk of dehydration • Elderly, young, and immunocompromised at greatest risk of death
Pathogenesis • Localized infection of the epithelial cells of the small intestines • P2 domain of major capsid protein, VP1, binds HBGA cells on the epithelial cell surface • Virus replication • disrupts normal function of the cells • interfering with absorption of nutrients and water
Immune response • Innate immune response • Polymorphonuclear and mononuclear cells • Adaptive immune response • B and T cells critical • IgG, IgA, IgM • No long-term immunity
Epochal evolution of Noroviruses • Periods of evolutionary stasis, followed by periods of rapid evolution • Changes in VP1 – new subclusters • Results in new phenotypes (subclusters) • Most changes occur in P domain of VP1 Camberwell Grimsby Farmington Hills 1987-1995 1995-2002 2002-2004
Treatment and prevention • Treatment • No drugs or vaccines • Supportive therapy • Prevention • Hand-washing • Avoiding contact with infected individuals • Disinfection
Laboratory diagnosis • Virus difficult to grow in culture • Real-time PCR is most common method • Sequencing – genotype samples
Tracking the source: Genotyping ORF2 region of the VP1 gene 5’ 3’ C D
CaliciNet • Founded by the CDC • Network of state and local health departments and government agencies like the FDA • Purpose: to create a nationwide database consisting entirely of Norovirus genome sequences
Purpose • To sequence region C of the genome of noroviruses present in human stool samples submitted to the Texas Department of State Health Services in 2009-2010 • Contribute to the nationwide CacliciNet database
Study population • 55 patients with diarrheal disease in Texas, 2009-2010 • 2 patient populations • 46 from 20 male-only prisons in Texas • 9from 5 nursing homes • Stool specimen and submitter formssubmitted to TDSHS from each patient
Demographic data Submitter forms with demographic data Entered data into excel spreadsheet Analyzed variables Gender Age Symptoms Location Report results
Stool specimens Stool specimens submitted to TDSHS, 2009 and 2010 Screened using real-time PCR 55 Norovirus-positive samples Sequenced region C
Sequencing protocol Agarose gel electrophoresis Extract RNA Perform RT-PCR Ethanol precipitation PCR – cycle sequencing Gel purification Sequence analysis Sequencing
Gender 9 40 N=49
Age of population by location Number of patients N=37
Symptoms Number of patients N=16
Location in Texas by county 2 1 2 2 2 2 2 8 1 5 2 2 2 1 4 2 2 2 2 1
Electrophoretic profile from reverse PCR of 15 Norovirus samples 1 2 3 4 5 6 7 8 9 10 11 12 13 14 15 16
Sequencing results • 38/55 successfully sequenced • 9 were unable to be reverse transcribed • Low virus levels in stool specimen • PCR failed • 8 were unable to be sequenced • Poor quality DNA template • Too much/little DNA • Contaminants
Genotyping results • 38 sequences were compared to other sequences in CaliciNet database • 12 - 2009 samples: • 12/12 GII.4 Minerva • 26 - 2010 samples: • 24/26 GII.4 New Orleans • 2/26 GII.12 (unnamed)
Genotyping by patient type Number of patients N=38
Conclusions: Demographic analyses • Samples not representative of the general population in the State • Two populations • Prisons – 40 men; average age 41 • Nursing homes – 9 women; average age 78
Noroviruses in prisons – a closed population? • How do outbreaks spread through the prison system? • Food service • Laundry service • Prison hospitals • 2010 Texas prison outbreak
Conclusions: Laboratory results • Successfully sequenced 38 Norovirus region C genome sequences • Add 38 sequences to the TDSHS database
GII.4: Minerva subcluster Emerged in 2006 • Named after cruise ship • Caused outbreak • Still circulating
GII.4: New Orleans subcluster • Emerged in late 2009 • CDC announced new subcluster in April, 2010 • Named for New Orleans • Outbreak associated with eating raw oysters • Oyster beds closed • Widespread • 15 states • 50% of norovirus cases to date in 2010
New genocluster: G II.12 (Unnamed) • Data from ViroMed Laboratory about norovirus genotyping results, 2009-2010 • 20/50 states GII.12 + B. Lembke and C. Cartwright, Abstr. 26th Ann. Clinical Virol. Symp. 2010.
CaliciNet statistics • Submissions to CaliciNet • 538 outbreaks • 54% GII.4 New Orleans • 13% GII.12 L. Barclan, N. Gregoricus, E. Vega, and J. Vinje, Abstr. IV Calicivirus Int. Conf., abstr.I-6, 2010.
Evolving genoclustersand subclusters in Texas, 2009-2010 2009 2010 100% New Orleans Nursing Homes Prisons 100% Minerva 92% New Orleans 100% Minerva 8% GII.12
Limitations • Small sample size, not representative of the State • Incomplete submitter forms – incomplete data • Unable to successfully genotype all 55 samples – technical difficulties
Future Studies • Sequence region D of the genome • Sequence more samples • Compare Texas outbreaks with other states