Download
1 / 37
380 likes | 703 Views
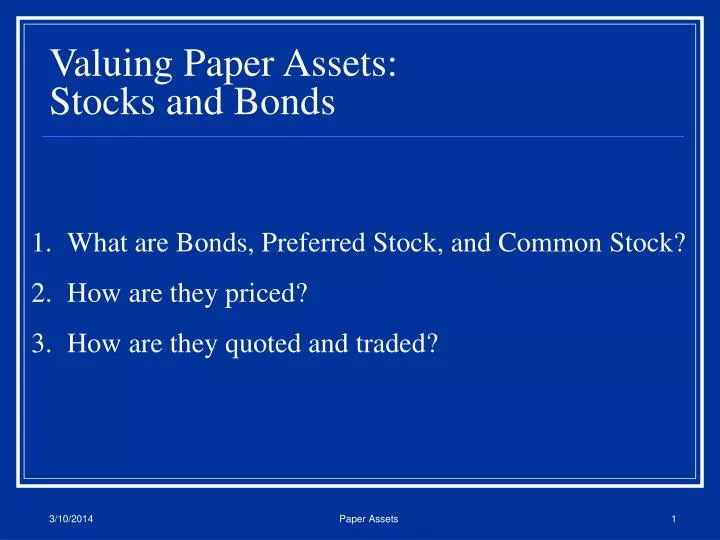
Valuing Paper Assets: Stocks and Bonds. What are Bonds, Preferred Stock, and Common Stock? How are they priced? How are they quoted and traded?. Debt (Bonds). Fixed or variable interest rate Secured or unsecured Fixed maturity date Sinking fund or periodic repayment Early retirement

E N D
Valuing Paper Assets:Stocks and Bonds • What are Bonds, Preferred Stock, and Common Stock? • How are they priced? • How are they quoted and traded? Paper Assets
Debt (Bonds) • Fixed or variable interest rate • Secured or unsecured • Fixed maturity date • Sinking fund or periodic repayment • Early retirement • Interest tax deductible • Priority in liquidation Paper Assets
Preferred Stock • Fixed dividend payment (cumulative and non-cumulative) • No fixed maturity date • Flexibility to skip dividend payment • Possibility of call or conversion • Lower priority in liquidation • Priority in dividends • No tax deductibility of dividends Paper Assets
Common Stock • No fixed dividend • Voting rights • Lowest priority in liquidation • Lowest priority in dividends • No fixed maturity • No tax deductibility of dividends • Residual risk and profits Paper Assets
General Valuation Model Paper Assets
Cash Flow for Bonds Paper Assets
Bond Value = Price of the bond = Interest payments = Principal payments at maturity = Number corresponding to a period; running from 1 to n = Total number of periods = Yield to maturity (or required rate of return) Paper Assets
A Premium Bond (Annual Compounding) (face value) (interest payment) (years to maturity) (market rate) Present Value of Face Value Present Value of Coupons Total Bond Value Paper Assets
A Discount Bond (Annual Compounding) (face value) (interest payment) (years to maturity) (market rate) Present Value of Face Value Present Value of Coupons Total Bond Value Paper Assets
Bond Price Table(10 Percent Interest Payment 20 Years to Maturity) Paper Assets
Bond Price Sensitivity to YTM Paper Assets
Impact of Time to Maturity on Bond Prices Time PeriodBond Price withBond Price with in Years8 Percent Yield12 Percent Yield (of 10 percent bond)to Maturityto Maturity • 0 . . . . . . . . $1,000.00 $1,000.00 • 1 . . . . . . . . 1,018.60 982.30 • 5 . . . . . . . . 1,080.30 927.50 • 10 . . . . . . . . 1,134.00 887.00 • 15 . . . . . . . . 1,170.90 864.11 • 20 . . . . . . . . 1,196.80 850.90 • 25 . . . . . . . . 1,213.50 843.30 • 30 . . . . . . . . 1,224.80 838.50 Paper Assets
Relationship Between Time to Maturity and Bond Price Bond Price ($) Assumes 8% yield to maturity 1,300 1,200 1,100 1,000 900 800 700 10% bond, $1,000 par value Assumes 12% yield to maturity 25 15 0 5 30 Number of years to maturity * The relationship in the graph is not symmetrical in nature. Paper Assets
Interest Rate Risk and Time to Maturity Paper Assets
Required Return on a Bond(Annual Compounding) Paper Assets
Semi-Annual Coupons Paper Assets
Bond Concepts • 1. Bond prices and market interest rates move in opposite directions. • 2. When coupon rate = YTM, price = par value. • When coupon rate > YTM, price > par value (premium bond) • When coupon rate < YTM, price < par value (discount bond) • 3. A bond with longer maturity has higher relative (%) price change than one with shorter maturity when interest rate (YTM) changes. All other features are identical. • 4. A lower coupon bond has a higher relative price change than a higher coupon bond when YTM changes. All other features are identical. Paper Assets
Cash Flows for Preferred Stock Paper Assets
Pricing Preferred Stock Note: The book uses R Paper Assets
Required Return on Preferred Stock Paper Assets
Common Stock Cash Flows Paper Assets
Common Stock Cash Flows extending out forever Paper Assets
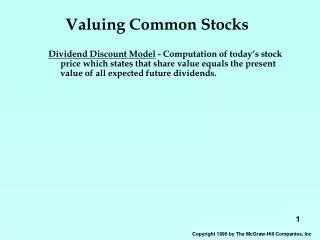
Constant Growth in Dividends(Gordon Growth Model) Paper Assets
Pricing Common Stock(Gordon Growth) Paper Assets
Required Return on Common Stock Paper Assets
Stock Price Sensitivity to Required Return, r Paper Assets
Stock Price Sensitivity to Dividend Growth, g Paper Assets
Pricing Common StockP/E Concept = $10.00 = 5 = = $10.00 X 5 = $50.00 Paper Assets
P/E and DCF Models Moral: P/E multiples are calculated by dividing Price by EPS. Price is NOT calculated by multiplying EPS by the P/E. Paper Assets
Summary General: Bonds: Preferred Stock: Common Stock: Paper Assets
Different Classes of Securities Rate of Return (%) H: Common Stock G: Convertible Preferred Risk Premium F: Preferred Stock E: Income Bonds D: Subordinated Debentures C: Second Mortgage Bonds B: First Mortgage Bonds Riskless Rate of Return A: U.S. Treasury Bonds Risk to Investors Paper Assets
Stock Market Reporting Gap pays a dividend of 9 cents/share Gap has been as high as $52.75 in the last year. Given the current price, the dividend yield is ½ % Given the current price, the PE ratio is 15 times earnings Gap has been as low as $19.06 in the last year. 6,517,200 shares traded hands in the last day’s trading Gap ended trading at $19.25, down $1.75 from yesterday’s close Paper Assets
Stock Market Reporting Gap Incorporated is having a tough year, trading near their 52-week low. Imagine how you would feel if within the past year you had paid $52.75 for a share of Gap and now had a share worth $19.25! That 9-cent dividend wouldn’t go very far in making amends. Yesterday, Gap had another rough day in a rough year. Gap “opened the day down” beginning trading at $20.50, which was down from the previous close of $21.00 = $19.25 + $1.75 Looks like cargo pants aren’t the only things on sale at Gap. Paper Assets
Stock Market Reporting Paper Assets
Corporate Bond Reporting • Highlighted quote in Figure: • ATT 6.250 Mar 15, 2011 • 102.613 5.627 Paper Assets
Government Bond Reporting Highlighted quote in Figure: 7.000 Jul 06n 100:13 100:14 4.78 Paper Assets
Two Bonds with Different Maturities Paper Assets