Download

1 / 41
0 likes | 32 Views
Discover insights into the UTI Multi-Asset Allocation Fund through our comprehensive product presentation for May 2024. Learn about its features, benefits, and investment strategies. <br><br>https://www.utimf.com/mutual-funds/uti-multi-asset-allocation-fund

E N D
Why invest in UTI Multi Asset Allocation Fund? The Fund follows a Disciplined and valuation driven Asset Allocation Strategy based on a proprietary financial model to circumvent investor‘s emotions of fear & greed With dynamic asset allocation and periodic review and rebalancing, fund focus on generating better risk adjusted returns by reducing portfolio volatility A single route access to a diversified portfolio across equity, fixed income & gold A tax - efficient way of portfolio diversification with equity taxation. Investors should consult their financial advisers if in doubt about whether the product is suitable for them. 2
Offers Opportunities across Asset Class Hedge against Inflation & Currency Depreciation Wealth Creation of Long Term Income Generation Fixed Income Equity Gold High Return Potential with Relatively Higher Volatility Moderate Returns & Volatility and Store of Value during Periods of Uncertainties Moderate Returns with Relatively lesser Volatility 4
Asset Classes behave differently across Market Events 73% 80% 63% 52% 60% 33% 40% 32% 24% 19% 18% 18% 18% 20% 11% 10% 8% 8% 6% 5% 5% 4% 3% 1% 0% -1% -4% -20% -13% -15% -17% -40% -37% -60% -52% E1 E2 E3 E4 E5 E6 E7 E8 E9 Equity Fixed Income Gold Events From To Events From 30/08/2013 07/02/2020 23/03/2020 18/01/2022 17/06/2022 To E5 Oil Price Correction E6 Covid-19 Pandemic E7Post Covid Recovery E8 Geo- Political Tension E9 Rising Interest Rates & Market Recovery 31/03/2015 23/03/2020 18/01/2022 17/06/2022 30/04/2024 E1 E2 E3 E4 Tech Bubble Meltdown Economic Growth Global Financial Crisis Post Crisis Recovery 14/02/2000 28/04/2003 10/01/2008 09/03/2009 28/04/2003 10/01/2008 09/03/2009 09/11/2010 Source : World Gold Council, NSE Indices Ltd and AMFI . Past performance may or may not be sustained in the future Data used for asset classes: Equity-NIFTY 50 TRI, Fixed Income-NIFTY 10 year benchmark G Sec, WGC Gold Rate (Unit per troy ounce) 5
Advantage of Asset Allocation Individual Asset Class Asset Allocation 25.0% 20.0% 18.6% 22.2% 17.5% 18.0% 20.0% 16.0% 14.4% 16.9% 13.4% 13.0% 13.0% 14.0% 14.1% 15.0% 12.0% 12.1% 10.0% 10.0% 8.0% 7.8% 5.7% 6.0% 5.0% 4.0% 2.0% 0.0% 0.0% Equity Fixed Income Gold 65E+25FI+10G 65E+10FI+25G 80E+10FI+10G Returns Standard Deviation Returns Standard Deviation Therefore, an optimal combination of Equity, Fixed Income and Gold would have generated portfolio returns closer to Equity with lower volatility Low/negative correlation between these asset classes i.e. In Last 10 years the correlation of Equity with Fixed Income is -0.16 and Gold is -0.50 Source : Data used for asset classes: Equity-NIFTY 50 TRI, Fixed Income-NIFTY 10 year benchmark G Sec, WGC Gold Rate INR (Unit per troy ounce) E-Equity, FI – Fixed Income & G-Gold. Data - June 30, 1999 to April 30 ,2024 Past performance may or may not be sustained in the future 6
Proprietary Financial Model developed In-house drives the allocation across asset % of % of % of gold allocation fixed income allocation Unhedged Equity allocation @ 10%-25% 10%-25% 40%-80% Price to Earnings Ratio Gold/Equity (G/E) Ratio Indicates allocation to Gold which is based on historical trends since 1999 Residual Allocation goes to High rated Fixed Income & money market instruments • Price to Book Value Ratio Dividend Yield Yield Gap* When G/E Ratio is below mean, the allocation to Gold is Higher and vice versa • These 4 factors have high correlation with 1 year forward returns. Investment at relatively lower PE, PB ratio generates high returns in subsequent periods and vice-versa • • *Yield gap is difference of Equity Yield ( 1/I year Nifty Forward PE) and Bond Yield ( 10 Yr G Sec Yield) * Asset Allocation as per Scheme Information Document @ Unhedged equity exposure as per the proprietary financial model can be in the range of 40% to 80%, however as per SID the scheme will maintain overall minimum 65% to Equity & Equity Instrument and the difference wherever applicable will be in Arbitrage. 8
Financial Model : Net Equity Allocation vs P/E and P/B ratio Model based on statistical analysis of Nifty Index using Statistical Tool Proprietary Financial Model - Equity Allocation vis-a-vis P/E ratio Proprietary Financial Model - Equity Allocation vis-a-vis P/B ratio 85 23 85 4 80 80 21 75 75 4 70 70 19 Weights (%) 65 3 65 Weights (%) 60 60 17 55 3 55 15 50 50 45 2 45 13 40 40 35 2 35 11 May-14 Sep-17 Feb-11 Oct-18 Jan-22 Nov-19 Dec-20 Mar-12 Mar-23 Aug-16 Apr-13 Jun-15 Apr-24 Feb-11 May-14 Sep-17 Oct-18 Jan-22 Nov-19 Mar-12 Jun-15 Dec-20 Mar-23 Apr-13 Apr-24 Aug-16 Model Equity Weight Price to Book ratio Model Equity Weight Forward P/E ratio Valuation Based - P/E & P/B are Negatively Correlated thus Higher PE/PB Ratio - Less Allocation to Equity 9
Financial Model : Net Equity Allocation vs DY & Yield Gap Proprietary Financial Model - Equity Allocation vis-a-vis Yield Gap* Proprietary Financial Model - Equity Allocation vis-a-vis Dividend Yield 85 85 3 2 80 80 75 2 75 2 70 70 Weights (%) 1 65 Weights (%) 65 2 60 60 0 55 55 1 -1 50 50 45 1 45 -2 40 40 35 1 35 -3 May-14 Sep-17 Feb-11 Oct-18 Dec-20 Jan-22 Nov-19 Mar-12 Mar-23 Aug-16 Apr-13 Jun-15 Apr-24 Feb-11 May-14 Sep-17 Oct-18 Jan-22 Aug-16 Nov-19 Dec-20 Mar-12 Jun-15 Mar-23 Apr-13 Apr-24 Model Equity Weight Dividend Yield Model Equity Weight Yield Gap Yield Based - Dividend Yield & Yield gap are Positively Correlated thus Higher DY/Yield Gap - Higher Allocation to Equity January 03,2011 to April 30,2024- Model Inception Date – Jan 2011, *Yield gap is difference of Equity Yield ( 1year Nifty Forward PE) and Bond Yield ( 10 Yr G Sec Yield) 10
Financial Model : Net Equity Allocation Vs Next 1 Yr. Return 80 80% 75 60% Nifty 1 Year forward Returns 70 Equity Allocation % 40% 65 60 20% 55 0% 50 -20% 45 40 -40% Apr 11 Feb 12 Apr 14 Nov 14 Feb 15 Apr 16 Nov 17 Jun 18 Apr 19 Nov 19 Feb 20 Nov 22 Apr 24 May 12 Sep 15 May 17 Sep 18 May 20 Sep 20 May 22 Sep 23 Aug 12 Jun 13 Aug 14 Jun 15 Aug 17 Aug 22 Jun 23 Mar 13 Mar 18 Mar 21 Mar 23 Jul 11 Jul 16 Jul 19 Jul 21 Dec 12 Dec 23 Dec 10 Oct 11 Oct 13 Jan 14 Dec 15 Oct 16 Jan 17 Jan 19 Dec 20 Oct 21 Jan 22 Equity Allocation (LHS) Nifty 1 year Forward Return (RHS) Next 1 Year Nifty Returns Allocation Range No. of Observations % of Instances % of Minimum -23.58% -29.76% -27.43% -0.90% Avg. Next 1Yr Returns of Nifty 5.68% 8.47% 11.15% 34.73% Equity Allocation Range Between 40% -50% Between 51% -60% Between 61% -70% Between 71% -80% Total Average Maximum 24.11% 37.53% 48.33% 96.65% Observations 398 864 1370 583 3215 12% 27% 43% 18% 100.0% Data – January 03,2011 to April 30,2024. Past performance may or may not be sustained in the future The Current Investment strategy is subject to change depending on the market conditions 11
Financial Model : Equity Allocation Vs Nifty Movement – Last 5 Years Net Equity Allocation Triggers by the model 25,000 80 75 20,000 70 Net Equity Allocation Nifty Index Levels 65 15,000 60 10,000 55 50 5,000 45 0 40 Axis Title Net Equity Weight (RHS) Nifty PRI Data – January 01, 2018 to April 30,2024. Past performance may or may not be sustained in the future The Current Investment strategy is subject to change depending on the market conditions 12
Financial Model : Gold Allocation Gold / Equity Ratio 6.00 6194 2.68 1.89 Total Daily Observations Mean – GE Ratio Current (April 2024) - GE Ratio 5.00 4.00 3.00 No. of Avg. Next 1Yr Returns of Gold Particulars 2.00 Observations 1.00 15.08% 14.22% 10.03% 6.16% 1524 2163 1384 1085 Gold to Equity Ratio below 2 Gold to Equity Ratio between 2 to 2.68 Gold to Equity Ratio between 2.69 to 3.50 Gold to Equity Ratio Above 3.50 0.00 Jun-99 Jun-04 Jun-09 Oct-21 Nov-11 Nov-16 Jan-23 Dec-01 Mar-03 Dec-06 Mar-08 Aug-10 Aug-15 Jul-20 Apr-24 Sep-00 Sep-05 Feb-13 May-14 Feb-18 May-19 Gold/Equity Ratio Mean Based on Gold/Equity Ratio the above table shows Gold Returns i.e. when the Gold/Equity ratio has been less than mean , the next 1 returns of Gold has been considerable and vice versa. Source : World Gold Council, NSE Indices Ltd and AMFI. Period : June 30, 1999 to April 30, 2024 Data used for asset classes: Equity-NIFTY 50 TRI, WGC Gold Rate INR/10 Grams. Past performance may or may not be sustained in the future. 13
Financial Model : Gold Allocation Vs Next 1 Yr. Return 25 75% 23 Gold 1 Year forward Returns 21 55% Equity Allocation % 19 17 35% 15 13 15% 11 9 -5% 7 5 -25% Feb 12 Feb 15 Apr 24 May 12 May 17 May 20 May 22 Apr 11 Apr 14 Nov 14 Apr 16 Nov 17 Apr 19 Nov 19 Feb 20 Nov 22 Sep 15 Sep 18 Sep 20 Sep 23 Aug 12 Jun 13 Aug 14 Jun 15 Aug 17 Jun 18 Aug 22 Jun 23 Mar 18 Mar 21 Mar 13 Mar 23 Jul 11 Jul 16 Jul 19 Jul 21 Dec 10 Oct 11 Dec 12 Oct 13 Jan 14 Dec 15 Oct 16 Jan 17 Jan 19 Dec 20 Oct 21 Jan 22 Dec 23 Gold Allocation (LHS) Gold 1 year Forward Return (RHS) Next 1 Year Gold Returns Allocation Range No. of Observations % of Instances Minimum -20.36% -7.76% -0.64% -0.14% Average 1.06% 11.41% 11.92% 16.80% Maximum 43.28% 48.06% 51.97% 48.69% Upto 10% 1427 871 384 533 3215 42.5% 28.2% 13.8% 15.5% 100.0% Between 10% -15% Between 15% -20% Above 20% Total Data – January 03,2011 to April 30, 2024. Past performance may or may not be sustained in the future The Current Investment strategy is subject to change depending on the market conditions 14
Financial Model : Gold Allocation Vs Gold Price Movement – Last 5 Years Gold Allocation Triggers by the model 80,040 25 70,040 20 60,040 50,040 Gold Prices per 10 Grams Gold Allocation 15 40,040 10 30,040 20,040 5 10,040 40 0 Jul 19 Aug 19 Sep 19 Sep 19 Mar 20 Feb 21 Mar 21 Apr 21 Jun 21 Aug 21 Feb 22 Feb 22 Mar 22 Mar 22 Apr 22 Apr 22 Aug 22 Sep 22 Oct 22 Oct 22 Dec 22 Jan 23 Mar 23 Jun 23 Sep 23 Oct 23 Dec 23 Feb 24 Mar 24 Apr 24 Apr 24 Gold Weight Weight (RHS) Gold Price (per 10 gms) Data – April 01,2018 to April 30,2024. Past performance may or may not be sustained in the future The Current Investment strategy is subject to change depending on the market conditions 15
Proprietary Financial Model : Model Periodic Performance Annualized Volatility CAGR Returns Fixed Income 6.13% 3.60% Fixed Income Model Portfolio Model Portfolio 21.55% 15.25% Period Gold Equity Period Gold Equity Benchmark Benchmark 1 Year 3 Years 5 Years 26.51% 16.92% 20.58% 14.26% 20.69% 13.52% 6.64% 7.63% 9.88% 13.14% 12.16% 13.79% 2.67% 3.55% 6.90% 8.75% 1 Year 3 Years 12.70% 18.60% 15.92% 14.09% 15.30% 14.30% 16.96% 9.65% 5.86% 6.90% 13.63% 12.41% 15.15% 4.11% 12.28% 5 Years 10 Years 10.64% 16.01% 13.94% 4.18% 10.51% 10 Years Relatively Superior Risk Adjusted Returns against Equity Across Time Period 3.25 3.50 3.00 2.68 2.50 2.00 2.00 1.32 1.29 1.25 1.50 0.89 0.82 1.00 0.50 0.00 1 Year 3 Years 5 Years 10 Years Portfolio Equity Data – January 03, 2011 to April 30, 2024 Source : Data used for asset classes: Equity-NIFTY 50, Fixed Income-NIFTY 10 year benchmark G Sec, WGC Gold Rate INR/10 Grams Model Analysis Inception Date – Jan 2011 Benchmark Equity - S&P BSE 200 TRI,Fixed Income- CRISIL Composite Bond Fund Index, Gold- UTI Gold ETF Relatively Superior Risk Adjusted Returns - Returns/Standard Deviation. Past performance may or may not be sustained in the future 16
Investment Strategy – Equity Portfolio Net long equity allocation will range between 40-80% Integrated Investing Combines fundamental research with market signals The strategy invests across the market cap spectrum Stock selection based on market signals • Market factor – Momentum/ Volatility • Fundamental factor – Quality/ Growth/ Value • Size factor – Large/ Mid/ Small Caps Dynamic management across the factors based on risk-reward 18
Investment Strategy – Fixed Income Portfolio 10-25% of the portfolio will be in debt & money market instruments Focus will be on the “Quality” and “Liquidity” of the portfolio Investments predominantly in Sovereign/ AAA/ equivalent rated issuers Portfolio duration basis interest rate scenario and outlook 19
Dynamic Asset Allocation* 80 68 67 70 65 65 63 63 63 62 61 61 60 59 58 57 57 57 60 56 55 55 53 53 52 52 47 50 44 % Asset Allocation 40 30 24 23 23 21 20 20 19 19 19 18 20 16 16 16 15 15 15 15 15 15 15 15 11 11 11 11 10 0 Fixed Income Gold Equity Unhedged Equity Exposure Since Model Implementation – April 1,2022 to April 30, 2024 Source MFI Explorer The current portfolio and strategy is based on current market conditions and is subject to change. 21
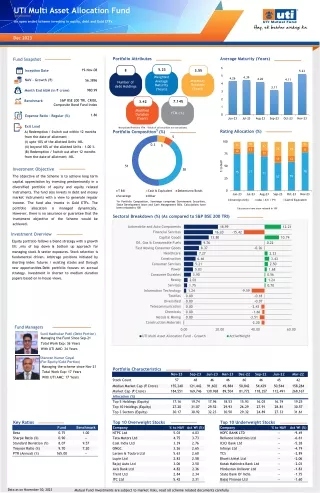
UTI Multi Asset Allocation Fund : Current Portfolio Asset Allocation as on April 30, 2024 Asset Class % of Net Assets Equity 67.49 Unhedged 46.84 Hedged 20.65 Gold Fixed Income 10.77 21.72 Total 100% Source MFI Explorer as on April 30, 2024 The current portfolio and strategy is based on current market conditions and is subject to change Benchmark Equity -S&P BSE 200 TRI.Act. Wt % - Active Weight % based on Net equity as compared to the S&P BSE 200 – Equity Benchmark. Data as of April 30, 2024 22
UTI Multi Asset Allocation Fund : Equity Portfolio Details Top 10 Stocks Top 10 Stocks % Larsen And Toubro Limited 2.62 Bharti Airtel Ltd. 2.54 ICICI Bank Ltd 2.41 Reliance Industries Ltd. 2.38 NTPC Ltd. 2.25 Top 5 Sectors Sun Pharmaceuticals Industries Ltd. 2.20 Top 5 Sectors Equity % Zomato Ltd 1.77 Financial Services 13.89 Trent Limited 1.64 Oil, Gas & Consumable Fuels 11.90 Tata Motors Ltd. 1.57 Automobile and Auto Components Healthcare Fast Moving Consumer Goods 9.53 9.37 7.40 Maruti Suzuki India Ltd. 1.33 Source MFI Explorer as on April 30, 2024 The current portfolio and strategy is based on current market conditions and is subject to change Benchmark Equity -S&P BSE 200 TRI.Act. Wt % - Active Weight % based on Net equity as compared to the S&P BSE 200 – Equity Benchmark. Data as of April 30, 2024 23
Large Cap,Mid Cap & Small Cap Allocation 90 79 78 77 77 80 75 73 73 70 68 67 70 78 60 59 59 58 60 56 53 52 50 50 50 49 50 45 44 40 40 30 20 10 0 Large Cap Mid Cap Small Cap Currently Portfolio is tilted towards Large Cap 24 Data as on April 30, 2024
UTI Multi Asset Allocation Fund : Fixed Income Portfolio Details Portfolio Composition Asset Allocation* % Credit Rating % Sovereign/AAA/A1+ & Equivalent AA+/AA Corporate Bond 2.81 100% G-Sec/SDL/T-Bills 87.89 -- Treps/Repo/Cash. 7.58 Below AA -- Corporate Bonds -- Total 100% Total 100% Key Indicators Pportfolio Quant Yield to Maturity^ (YTM) (%) 7.09% Average Maturity (Years) 5.53 Modified Duration (Years) Macaulay Duration (Years) 3.79 3.93 Source MFI Explorer as on April 30, 2024. ^ AnnualisedPortfolio YTM –Yields of the all the securities are annualised The current portfolio and strategy is based on current market conditions and is subject to change. * Rebased to 100 25
Performance 26
NAV Movement Vs Other Asset Classes-* 160 150 140 130 120 110 100 90 80 UTI Multi Asset Allocation Fund - Growth S&P BSE 200 TRI CRISIL Composite Bond Fund Index UTI Gold ETF Standard Deviation Returns (%) Last 1 Year (CAGR)^ 39.52% 35.91% 6.72% 18.64% 26.88% Last 1 Year (CAGR)^ 7.28% 10.15% 1.48% 10.80% 8.04% Since April 2022* Since April 2022* UTI Multi Asset Allocation Fund– Regular Plan Growth Option Equity - S&P BSE 200 TRI Fixed Income- CRISIL Composite Bond Fund Index Gold - UTI Gold ETF Benchmark * 21.50% 17.38% 5.82% 15.64% 14.32% 8.67% 12.65% 2.30% 11.36% 9.90% $ - Since Proprietary Financial Model Implementation – April 2022 ^ Last 1 Year – Mar 31,2023 to Apr 30,2024 . Data As on April 30,2024 – CAGR (Greater than or Equal to 1 year Compound Annualized returns) – *Benchmark Equity - S&P BSE 200 TRI,Fixed Income- CRISIL Composite Bond Fund Index, Gold- UTI Gold ETF The current portfolio and strategy is based on current market conditions and is subject to change. For the above graph, NAV of UTI Multi Asset Allocation Fund and Index Values of Equity & Fixed Income Index along with Gold prices has been rebased at 100 from 1stApril,2022. Past performance may or may not be sustained in the future 27
UTI Multi Asset Allocation Fund - Snapshot Fund Manager Minimum Investment Type of scheme Fund Inception Minimum amount of investment under all plans and options Minimum initial investment amount ₹ 5,000/- and in multiples of ₹ 1/- thereafter. investment under a folio is Rs.1000/- and in multiples of Re.1/- thereafter with no upper limit subject to subscription restrictions, as aforesaid. Minimum minimum amount of each investment for SIP is ₹ 500 (for Daily, Weekly and Monthly Option) and ₹ 1500 (for Quarterly Option). Sharwan Kumar Goyal* (For Equity / Gold Portion) Sunil Patil** (For Fixed Income Portion) An open ended scheme investing in equity, debt and Gold ETFs. Nov 19, 2008 Subsequent minimum SIP Amount: The Investment Objective Benchmark Asset Allocation ` S&P BSE 200 TRI, CRISIL Composite Bond Index & Price of Gold The objective of the Scheme is to achieve long term capital appreciation by investing predominantly in a diversified portfolio of equity and equity related instruments. The fund also invests in debt instruments with a view to generate regular income. The fund also invests in Gold ETFs. The portfolio allocation is managed dynamically. However, there is no assurance or guarantee that the investment objective of the Scheme would be achieved Indicative Allocation (% of total assets) Instruments Risk Profile Minimum Maximum Equity & equity related instruments Debt and Money Market instruments (including securitized debt)* Gold ETFs Units issued by REITs & InvITs and money market 65% 80% Medium to High 10% 25% Low to Medium 10% 25% High 0% 10% Medium to High 28 Details as on April 30, 2024. * Managing Since Nov 2021 , ** Managing Since Sept 2021.
About our Investment Managers Mr. Sunil Patil is associated with UTI AMC since 1989. He holds a degree in Masters in Financial Management Commerce. He has 34 years of rich experience in Primary Market Investment and Dealing. He is an integral part of the Fixed Income Fund Management team and is currently managing portfolios of UTI Fixed Term Income Funds, UTI Fixed Income Interval Funds, 4 Target Maturity Debt Index Funds, UTI Medium to Long Duration Fund and UTI Long Duration Fund and debt portion of UTI Aggressive Allocation Fund, UTI Retirement Fund, UTI Unit Linked Insurance Plan, UTI Children's Hybrid Fund and UTI Equity Savings Fund. Sharwan Goyal is Fund Manager and Head - Passive, Arbitrage and Quant strategies at UTI AMC. He is a CFA Charter holder from CFA Institute, USA and also holds a Post-graduate degree in Welingkar Institute of Management, Mumbai. He has over 16 years of experience in Risk Management, Equity Research, Portfolio Analysis and Fund Management at UTI AMC. He Manages 20 Scheme's in UTI in Passive strategy and Equity/Gold Allocation Fund and Arbitrage Fund (along with Mr. Amit Sharma) and Masters in Management (MMS) from Hybrid Fund, UTI Multi-Asset Portion of UTI Multi Asset Details as on April 30, 2024 29
Performance Track Record UTI Multi Asset Allocation Fund Performance Vs Benchmark (CAGR) as on April 30, 2024 Growth of ₹10000 Fund Performance Vs Benchmark Growth of ₹10,000/- Period Scheme Returns (%) 39.90 18.30 14.54 13.03 Scheme Returns ( ₹ ) 13990 16563 19729 66389 Benchmark@ (₹) AB - Nifty 50 TRI (₹) Benchmark@ (%) AB - Nifty 50 TRI (%) 1 Year 3 Years 5 Years Since Inception* 26.20 15.16 15.15 14.95 26.51 16.92 15.30 16.28 12620 15278 20261 86130 12651 15990 20393 102889 @ - Benchmark @S&P BSE 200 TRI, CRISIL Composite Bond Index & Price of Gold, AB - Additional Benchmark, TRI - Total Return Index Different plans have a different expense structure. The performance details provided herein are of regular plan. @S&P BSE 200 TRI, CRISIL Composite Bond Index & Price of Gold *Compounded annualized Growth Rate. For performance details of other Schemes managed by the Fund Manager, please refer the respective Scheme sheets as listed in page 98 in ‘Fund Manager Summary’. N.A - Not Available. Schemes Managed by Mr. Sunil Madhukar Patil , Mr. Sharwan Kumar Goyal . The performance of the benchmark is calculated using total return index variant of the benchmark index. SIP Returns as on April 30, 2024 AB - Nifty 50 TRI (₹) Yield (%) Benchmark@ Yield (%) Nifty 50 TRI Fund Value (₹) Benchmark@ (₹) Period Investment Value Yield (%) Fund 1 Year 120000 146074 136583 135651 42.75 26.67 25.12 3 Years 360000 511011 458345 461371 24.16 16.35 16.82 5 Years 600000 968299 909869 953146 19.24 16.69 18.59 Since Inception* 1820000 4609251 5454952 5919667 11.11 13.03 13.95 Note: Systematic Investment Plan (SIP) returns are worked out assuming investment of ₹ 10,000/- every month at NAV per unit of the scheme as on the first working day for the respective time periods. The loads have not been taken into account. Past performance may or may not be sustained in future. @S&P BSE 200 TRI, CRISIL Composite Bond Index & Price of Gold 30
Performance details of other schemes managed by the fund managers Performance details of other schemes managed by Fund manager – Mr. Sharwan Kumar Goyal Top 3 Schemes managed by the Fund Manager Returns as on April 30, 2024 Managing the Fund Since 1 Year (%) 3 Years (%) 5 Years (%) Inception Date Scheme Name Fund Benchmark Fund Benchmark Fund Benchmark Fund Benchmark UTI Nifty 200 Momentum 30 Index Fund Nifty 200 Momentum 30 Index TRI 10-Mar-2021 Mar 2021 68.17 69.40 25.84 27.07 -- -- 04-Aug-2017 Aug 2017 Nifty Next 50 TRI UTI Nifty Next 50 ETF 64.46 64.69 23.94 24.13 19.40 19.50 28-Jun-2018 Jun 2018 Nifty Next 50 TRI UTI Nifty Next 50 Index Fund 63.39 64.69 23.07 24.13 18.51 19.50 Bottom 3 Schemes Managed by the Fund Manager Returns as on April 30, 2024 Managing the Fund Since 1 Year (%) 3 Years (%) 5 Years (%) Inception Date Scheme Name Fund Benchmark Fund Benchmark Fund Benchmark Fund Benchmark 21-April-2023 Apr 2023 Domestic Price of Silver UTI Silver ETF FoF -5.77 8.51 6.11 6.97 -- -- 22-June-2006 Dec 2020 Nifty 50 Arbitrage TRI UTI Arbitrage Fund 7.71 8.08 5.52 5.81 5.23 5.06 Aug 2020 Nifty Bank TRI 31-Aug-2020 UTI Nifty Bank ETF 14.95 15.09 15.27 15.40 -- -- a. b. c. d. e. Mr. Sharwan Goyal manages 20 open-ended schemes of UTI Mutual Fund. Top 3 and Bottom 3 funds has been selected on the basis of last 1 year returns of the scheme. Period during which the scheme’s performance has been provided is computed based on the last day of the month end preceding the date of advertisement. Different plans shall have different expense structures. Compounded annualized performance of Regular – Growth Option as on April 30,2024 is given. Past performance may or may not be sustained in the future. The loads have not been taken into account. 31
Performance details of other schemes managed by the fund managers Performance details of other schemes managed by Fund manager – Mr. Sunil Patil Managing the Fund Since 1 Year (%) 3 Years (%) 5 Years (%) Inception Date Scheme Name Fund Benchmark Fund Benchmark Fund Benchmark Fund Benchmark CRISIL Hybrid 35-65 Aggressive CRISIL Short Term Debt Hybrid 60+40 Fund Index UTI Aggressive Hybrid Fund (Debt Portion) UTI Retirement Fund (Debt Portion) UTI Equity Savings Fund (Debt Portion) UTI – Children Hybrid Fund (Debt portion) UTI Unit Linked Insurance Plan^ (Debt Portion) UTI – Medium to Long Duration Fund* (No. of segregated portfolio is the scheme 1) 02-Jan-1995 Feb-18 25.28 14.54 14.46 32.15 19.20 16.04 26-Dec-1994 Dec-21 19.65 18.13 11.16 11.02 11.65 13.13 30-Aug-2018 Aug-18 CRISIL Equity Savings Index 17.48 14.04 10.16 10.43 10.43 11.58 CRISIL Short Term Debt Hybrid 60+40 Index 12-Jul- 1993 Dec-21 15.98 18.13 11.16 9.54 11.65 10.43 NIFTY 50 Hybrid Composite Debt 50:50 Index 01-Oct-1971 Dec-21 12.09 16.36 11.20 7.45 11.94 7.60 CRISIL Medium to Long Duration Debt A-III Index 5.41 6.47 5.02 5.19 7.45 04-May- 1998 Apr-23 9.29 Returns as on April 30, 2024 *Note: The return disclosed is after taking impact of creation of UTI Bond Fund (Segregated-17/02/2020). For impact on NAV on account of segregation of portfolio, please refer SID/KIM of the scheme. Debt securities of Vodafone Idea Ltd. were segregated from the scheme due to “BB-”, i.e. “below investment grade” by CARE Ratings Ltd., on Feb 17, 2020. Further, the entire amount due (Principal + Accrued Interest) have been received from the issuer in multiple tranches as and when due. Subsequently all the units of the segregated portfolio were redeemed and the investors were duly paid in proportion to their holdings and the portfolio was closed w.e.f. Jan 27, 2022 . ^ Temporary discontinuation of fresh subscription w.e.f July 01, 2022 a. b. c. d. e. f. Mr. Sunil Patil manages 12 open-ended schemes of UTI Mutual Fund. Period during which the scheme’s performance has been provided is computed based on the last day of the month end preceding the date of advertisement. Different plans shall have different expense structures. Compounded annualized performance of Regular – Growth Option as on April 30, 2024 is given. Past performance may or may not be sustained in the future. Period of which the scheme’s performance has been provided is computed based on the last day of the month’s end preceding the date of advertisement. The loads have not been taken into account. 32
Performance details of other schemes managed by the fund managers Performance details of other schemes managed by Fund manager – Mr. Sunil Patil 1 Year (%) 3 Years (%) 5 Years (%) Managing the Fund Since Inception Date Scheme Name Fund Benchmark Fund Benchmark Fund Benchmark Fund Benchmark Nifty Long Duration Debt Index A-III 17-Mar-2023 Mar-2023 7.12 UTI Long Duration Fund 6.73 -- -- -- -- CRISIL IBX SDL Index – April 2033 UTI CRISIL SDL Maturity April 2033 Index Fund 21-Dec-2022 Dec-2022 6.85 6.96 -- -- -- -- UTI CRISIL SDL Maturity June 2027 Index Fund CRISIL IBX SDL Index – June 2027 10-Jan-2023 Jan-2023 6.51 6.78 -- -- -- -- UTI Nifty SDL Plus AAA PSU Bond Apr 2026 75:25 Index Fund Nifty SDL Plus AAA PSU Bond Apr 2026 75:25 Index 10-Feb-2023 Feb-2023 6.53 6.99 -- -- -- -- UTI Nifty SDL Plus AAA PSU Bond Apr 2028 75:25 Index Fund Nifty SDL Plus AAA PSU Bond Apr 2028 75:25 Index 03-Mar-2023 Mar-2023 6.49 6.81 -- -- -- -- Returns as on April 30, 2024 a. b. c. d. e. f. Mr. Sunil Patil manages 12 open-ended schemes of UTI Mutual Fund. Period during which the scheme’s performance has been provided is computed based on the last day of the month end preceding the date of advertisement. Different plans shall have different expense structures. Compounded annualized performance of Regular – Growth Option as on April 30, 2024 is given. Past performance may or may not be sustained in the future. Period of which the scheme’s performance has been provided is computed based on the last day of the month’s end preceding the date of advertisement. The loads have not been taken into account. 33
Product Label This product is suitable for investors who are seeking* Riskometer of Fund# Riskometer of Benchmark Name of the Scheme Nifty200 Momentum 30 TRI UTI Nifty 200 Momentum 30 Index Fund (An open-ended scheme replicating/tracking the Nifty200 Momentum 30 Index) • Capital growth in tune with the index returns • Passive investment in equity instruments comprised in Nifty200 Momentum 30 Index Nifty Next 50 TRI UTI Nifty Next 50 ETF (An open ended scheme replicating / tracking Nifty Next 50 Index • Long term investment. • Investment in securities covered by Nifty Next 50 Index Nifty Next 50 TRI UTI Nifty Next 50 Index Fund (An open ended scheme replicating/tracking the Nifty Next 50 Index) • Capital growth in tune with the index returns • Passive investment in equity instruments comprised in Nifty Next 50 Index *Investors should consult their financial advisers if in doubt about whether the product is suitable for them. #Risk-o-meter for the fund is based on the portfolio ending April 30, 2024. The Risk-o-meter of the fund/s is/are evaluated on monthly basis and any changes to Risk-o-meter are disclosed vide addendum on monthly basis, to view the latest addendum on Risk-o-meter, please visit addenda section on https://www.utimf.com/downloads 34
Product Label This product is suitable for investors who are seeking* Riskometer of Fund# Riskometer of Benchmark Name of the Scheme Nifty 50 Arbitrage TRI • Capital appreciation over medium to long term • Takes advantage of arbitrage opportunities in cash and derivative market without taking any directional/ unhedged position in either equity or derivative instruments UTI Arbitrage Fund (An open ended scheme investing in arbitrage opportunities) Domestic Price of Silver UTI Silver ETF FoF [An open-ended Fund of Fund Scheme investing in UTI Silver Exchange Traded Fund (UTI Silver ETF)] • Long term capital growth • Returns that are commensurate with the performance of UTI Gold ETF through investment in units of UTI Gold ETF Nifty Bank TRI UTI Nifty Bank ETF (An open-ended scheme replicating/tracking the Nifty Bank Index) • Long term capital growth • Returns that are commensurate with the performance of UTI Silver ETF through investment in units of UTI Silver ETF *Investors should consult their financial advisers if in doubt about whether the product is suitable for them. #Risk-o-meter for the fund is based on the portfolio ending April 30, 2024. The Risk-o-meter of the fund/s is/are evaluated on monthly basis and any changes to Risk-o-meter are disclosed vide addendum on monthly basis, to view the latest addendum on Risk-o-meter, please visit addenda section on https://www.utimf.com/downloads 35
Product Label This product is suitable for investors who are seeking* Riskometer of Fund# Riskometer of Benchmark Name of the Scheme CRISIL Medium to Long Duration Debt A-III Index UTI Medium to Long Duration Fund (An open ended medium term debt scheme investing in instruments such that the Macaulay duration of the portfolio is between 3 years and 4 years . A Relatively high interest rate risk and relatively high credit risk) • Capital appreciation over medium to long term • Takes advantage of arbitrage opportunities in cash and derivative market without taking any directional/ unhedged position in either equity or derivative instruments CRISIL Short Term Debt Hybrid 60+40 Index UTI Children's Hybrid Fund (An open ended fund for investment for children having a lock in for at least 5 years or till the child attains age of majority (whichever is earlier)) • Long term capital appreciation • Investment in equity instruments (maximum-40%) and debt instruments CRISIL Short Term Debt Hybrid 60+40 Index UTI Retirement Fund (An open ended retirement solution oriented scheme having a lock in of 5 years or till retirement age (whichever is earlier)) • Long term capital appreciation • Investment in equity instruments (maximum-40%) and debt/money market instruments *Investors should consult their financial advisers if in doubt about whether the product is suitable for them. #Risk-o-meter for the fund is based on the portfolio ending April 30, 2024. The Risk-o-meter of the fund/s is/are evaluated on monthly basis and any changes to Risk-o-meter are disclosed vide addendum on monthly basis, to view the latest addendum on Risk-o-meter, please visit addenda section on https://www.utimf.com/downloads 36
Product Label This product is suitable for investors who are seeking* Riskometer of Fund# Riskometer of Benchmark Name of the Scheme CRISIL Equity Savings Index • Long term capital appreciation and income • Investment in equity & equity related instruments, arbitrage opportunities, and investments in debt and money market opportunities UTI Equity Savings Fund (An open ended scheme investing in equity, arbitrage and debt) CRISIL Hybrid 35+65 - Aggressive Index UTI Aggressive Hybrid Fund (An open ended hybrid scheme investing predominantly in equity & equity related instruments) • Long term capital appreciation • Investment in equity instruments (maximum - 80%) and fixed income securities (debt and money market securities) Nifty 50 Hybrid Composite Debt 50:50 Index • Long term capital appreciation • • Investment in equity instruments (maximum-40%) and debt instruments UTI Unit Linked Insurance Plan (An Open-ended tax saving cum insurance scheme) *Investors should consult their financial advisers if in doubt about whether the product is suitable for them. #Risk-o-meter for the fund is based on the portfolio ending April 30, 2024. The Risk-o-meter of the fund/s is/are evaluated on monthly basis and any changes to Risk-o-meter are disclosed vide addendum on monthly basis, to view the latest addendum on Risk-o-meter, please visit addenda section on https://www.utimf.com/downloads 37
Product Label This product is suitable for investors who are seeking* Riskometer of Fund# Riskometer of Benchmark Name of the Scheme Nifty Long Duration Debt Index A-III UTI Long Duration Fund (An open ended debt scheme investing in instruments such that the Macaulay duration of the portfolio is greater than 7 years. Relatively High Interest rate risk and Relatively Low Credit Risk) • Income over the target maturity period • Investments in State Development Loans (SDLs), tracking CRISIL IBX SDL Index April 2033, subject to tracking error CRISIL IBX SDL Index – Maturity April 2033 UTI CRISIL SDL Maturity April 2033 Index Fund (An open-ended Target Maturity Debt Index Fund tracking CRISIL IBX SDL Index – April 2033. A Relatively High Interest Rate Risk and Relatively Low Credit Risk) • Long term capital appreciation • Investment in equity instruments (maximum - 80%) and fixed income securities (debt and money market securities) CRISIL IBX SDL Index – Maturity June 2027 UTI CRISIL SDL Maturity June 2027 Index Fund (An open-ended Target Maturity Debt Index Fund tracking CRISIL IBX SDL Index – June 2027. A Relatively High Interest Rate Risk and Relatively Low Credit Risk) • Income over the target maturity period • Investments in State Development Loans (SDLs), tracking CRISIL IBX SDL Index June 2027, subject to tracking error *Investors should consult their financial advisers if in doubt about whether the product is suitable for them. #Risk-o-meter for the fund is based on the portfolio ending April 30, 2024. The Risk-o-meter of the fund/s is/are evaluated on monthly basis and any changes to Risk-o-meter are disclosed vide addendum on monthly basis, to view the latest addendum on Risk-o-meter, please visit addenda section on https://www.utimf.com/downloads 38
Product Label This product is suitable for investors who are seeking* Riskometer of Fund# Riskometer of Benchmark Name of the Scheme Nifty SDL Plus AAA PSU Bond Apr 2026 75:25 Index UTI Nifty SDL Plus AAA PSU Bond Apr 2026 75:25 Index Fund (An open-ended Target Maturity Index Fund investing in constituents of Nifty SDL Plus AAA PSU Bond Apr 2026 75:25 Index A Relatively High Interest Rate Risk and Moderate Credit Risk) UTI Nifty SDL Plus AAA PSU Bond Apr 2028 75:25 Index Fund (An open-ended Target Maturity Index Fund investing in constituents of Nifty SDL Plus AAA PSU Bond Apr 2028 75:25 Index A Relatively High Interest Rate Risk and Moderate Credit Risk)) • Income over the target maturity period • Investments in PSU Bonds & State Development Loans (SDLs), tracking Nifty SDL Plus AAA PSU Bond Apr 2026 75:25 Index, subject to tracking error. Nifty SDL Plus AAA PSU Bond Apr 2028 75:25 Index • Income over the target maturity period • Investments in PSU Bonds & State Development Loans (SDLs), tracking Nifty SDL Plus AAA PSU Bond Apr 2028 75:25 Index, subject to tracking error *Investors should consult their financial advisers if in doubt about whether the product is suitable for them. #Risk-o-meter for the fund is based on the portfolio ending April 30, 2024. The Risk-o-meter of the fund/s is/are evaluated on monthly basis and any changes to Risk-o-meter are disclosed vide addendum on monthly basis, to view the latest addendum on Risk-o-meter, please visit addenda section on https://www.utimf.com/downloads 39
Potential Risk Class Matrix Credit Risk → Relatively Low (Class A) Moderate (Class B) Relatively High (Class C) Interest Rate Risk ↓ Relatively Low (Class I) A-I - B-I C-I - - Moderate (Class II) A-II - B-II - C-II - UTI Medium to Long Duration Fund UTI Long Duration Fund UTI CRISIL SDL Maturity April 2033 Index Fund UTI Nifty SDL Plus AAA PSU Bond Apr 2028 75:25 Index Fund Relatively High (Class III) A-III B-III C-III - UTI CRISIL SDL Maturity June 2027 Index Fund UTI Nifty SDL Plus AAA PSU Bond Apr 2026 75:25 Index Fund 40
Disclaimer REGISTERED OFFICE: UTI Tower, ‘GN’ Block, Bandra Kurla Complex, Bandra (E), Mumbai - 400051. Phone: 022 – 66786666. UTI Asset Management Company Ltd (Investment Manager for UTI Mutual Fund) Email: invest@uti.co.in. (CIN-L65991MH2002PLC137867). For more information, please contact the nearest UTI Financial Centre or your AMFI/NISM certified UTI Mutual Fund Independent Financial Advisor (IFA) for a copy of the Statement of Additional Information, Scheme Information Document, and Key Information Memorandum cum Application Form. Disclaimers: The information on this document is provided for information purposes only. It does not constitute any offer, recommendation, or solicitation to any person to enter into any transaction or adopt any hedging, trading, or investment strategy, nor does it constitute any prediction of likely future movements in rates or prices or any representation that any such future movements will not exceed those shown in any illustration. Users of this document should seek advice regarding the appropriateness of investing in any securities, financial instruments, or investment strategies referred to in this document and should understand that statements regarding future prospects may not be realized. The recipient of this material is solely responsible for any action taken based on this material. Opinions, projections, and estimates are subject to change without notice. UTI AMC Ltd is not an investment adviser and is not purporting to provide you with investment, legal, or tax advice. UTI AMC Ltd or UTI Mutual Fund (acting through UTI Trustee Company Pvt. Ltd) accepts no liability and will not be liable for any loss or damage arising directly or indirectly (including special, incidental, or consequential loss or damage) from your use of this document, howsoever arising, and including any loss, damage or expense arising from, but not limited to, any defect, error, imperfection, fault, mistake or inaccuracy with this document, its contents or associated services, or due to any unavailability of the document or any part thereof or any contents or associated services. The fund Strategy shown is subject to change with respect to peer-set and benchmark. Limits mentioned are internal prudential norms. For asset allocation and related details, please refer to the Scheme Information Document of the respective schemes. All complaints, regarding UTI Mutual Fund can be directed towards service@uti.co.in and for any unsatisfactory or lack of response visit https://scores.sebi.gov.in/ (SEBI SCORES portal) and /or visit https://smartodr.in/ (Dispute Resolution Portal) Mutual Fund Investments are subject to market risks, read all scheme related documents carefully. 41