Download
1 / 2
0 likes | 25 Views
UTI Multi Asset Allocation Fund (Formerly UTI Multi Asset Fund)Direct Growth Plan - Growth<br>An open ended scheme investing in equity, debt and Gold ETFs.The scheme aims to diversify allocation across equity, debt and gold asset classes. <br><br>https://www.utimf.com/mutual-funds/uti-multi-asset-allocation-fund

E N D
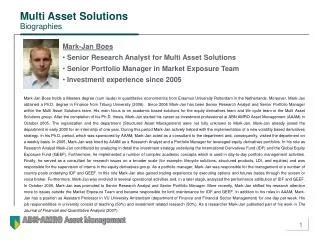
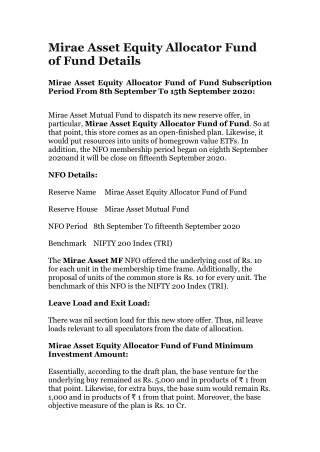
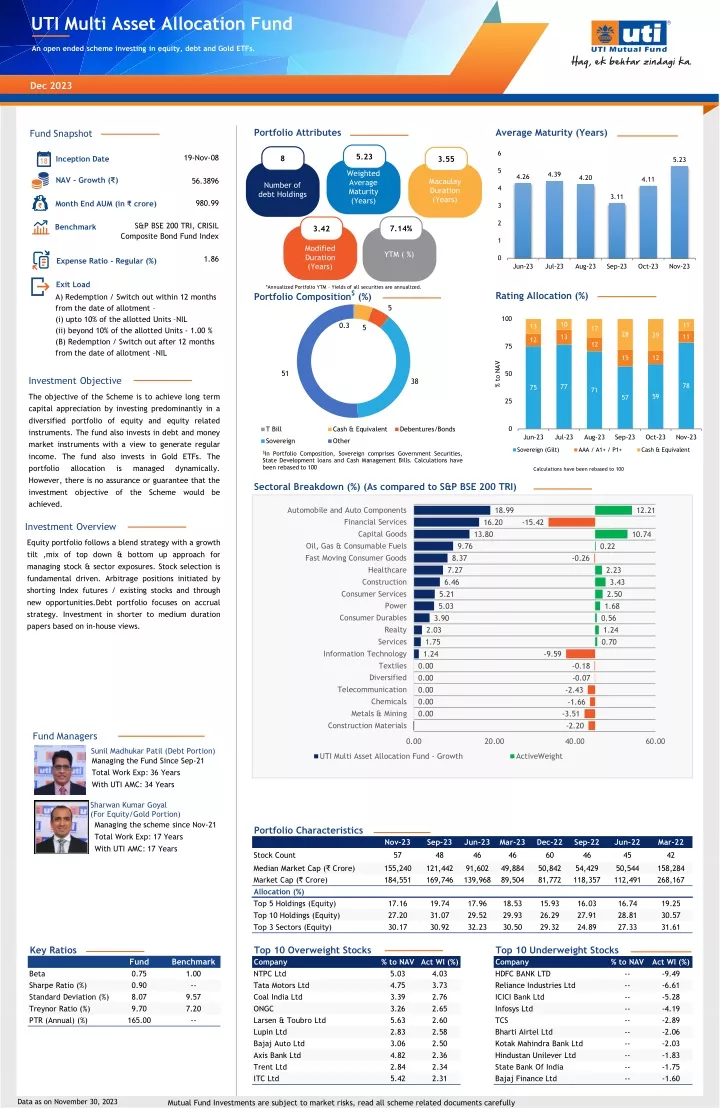
UTI Multi Asset Allocation Fund An open ended scheme investing in equity, debt and Gold ETFs. Dec 2023 Portfolio Attributes Average Maturity (Years) Fund Snapshot 6 5.23 19-Nov-08 8 Inception Date 3.55 5.23 5 Weighted Average Maturity (Years) 4.39 4.26 4.20 4.11 NAV - Growth (₹) 56.3896 Macaulay Duration (Years) Number of debt Holdings 4 3.11 980.99 Month End AUM (in ₹ crore) 3 2 S&P BSE 200 TRI, CRISIL Composite Bond Fund Index Benchmark 7.14% 3.42 1 Modified Duration (Years) YTM ( %) 0 1.86 Expense Ratio - Regular (%) Jun-23 Jul-23 Aug-23 Sep-23 Oct-23 Nov-23 Exit Load *Annualized Portfolio YTM – Yields of all securities are annualized. Portfolio Composition$ (%) Rating Allocation (%) A) Redemption / Switch out within 12 months from the date of allotment – (i) upto 10% of the allotted Units –NIL (ii) beyond 10% of the allotted Units ‐ 1.00 % (B) Redemption / Switch out after 12 months from the date of allotment –NIL 5 100 10 11 0.3 13 5 17 28 29 11 13 12 12 75 12 15 % to NAV 51 50 Investment Objective 38 78 77 75 71 The objective of the Scheme is to achieve long term capital appreciation by investing predominantly in a diversified portfolio of equity and equity related instruments. The fund also invests in debt and money market instruments with a view to generate regular income. The fund also invests in Gold ETFs. The portfolio allocation is However, there is no assurance or guarantee that the investment objective of achieved. 59 57 25 0 T Bill Cash & Equivalent Debentures/Bonds Jun-23 Jul-23 Aug-23 Sep-23 Oct-23 Nov-23 Sovereign Other Sovereign (Gilt) AAA / A1+ / P1+ Cash & Equivalent $In Portfolio Composition, Sovereign comprises Government Securities, State Development loans and Cash Management Bills. Calculations have been rebased to 100 Axis Title managed dynamically. Calculations have been rebased to 100 Sectoral Breakdown (%) (As compared to S&P BSE 200 TRI) the Scheme would be Automobile and Auto Components 18.99 12.21 Financial Services 16.20 -15.42 Investment Overview Capital Goods 13.80 10.74 Equity portfolio follows a blend strategy with a growth tilt ,mix of top down & bottom up approach for managing stock & sector exposures. Stock selection is fundamental driven. Arbitrage positions initiated by shorting Index futures / existing stocks and through new opportunities.Debt portfolio focuses on accrual strategy. Investment in shorter to medium duration papers based on in-house views. Oil, Gas & Consumable Fuels 9.76 0.22 Fast Moving Consumer Goods 8.37 -0.26 Healthcare 7.27 2.23 Construction 6.46 3.43 Consumer Services 5.21 2.50 Power 5.03 1.68 Consumer Durables 3.90 0.56 Realty 2.03 1.24 Services 1.75 0.70 Information Technology 1.24 -9.59 Textiles 0.00 -0.18 Diversified 0.00 -0.07 Telecommunication 0.00 -2.43 Chemicals 0.00 -1.66 Metals & Mining 0.00 -3.51 Construction Materials -2.20 Fund Managers 0.00 20.00 40.00 60.00 Sunil Madhukar Patil (Debt Portion) Managing the Fund Since Sep-21 Total Work Exp: 36 Years With UTI AMC: 34 Years UTI Multi Asset Allocation Fund - Growth ActiveWeight Sharwan Kumar Goyal (For Equity/Gold Portion) Managing the scheme since Nov-21 Total Work Exp: 17 Years With UTI AMC: 17 Years Portfolio Characteristics Nov-23 57 Sep-23 48 Jun-23 46 Mar-23 46 Dec-22 60 Sep-22 46 Jun-22 45 Mar-22 42 Stock Count Median Market Cap (₹ Crore) Market Cap (₹ Crore) Allocation (%) Top 5 Holdings (Equity) Top 10 Holdings (Equity) Top 3 Sectors (Equity) 155,240 184,551 121,442 169,746 91,602 139,968 49,884 89,504 50,842 81,772 54,429 118,357 50,544 112,491 158,284 268,167 17.16 27.20 30.17 19.74 31.07 30.92 17.96 29.52 32.23 18.53 29.93 30.50 15.93 26.29 29.32 16.03 27.91 24.89 16.74 28.81 27.33 19.25 30.57 31.61 Key Ratios Top 10 Overweight Stocks Company NTPC Ltd Tata Motors Ltd Coal India Ltd ONGC Larsen & Toubro Ltd Lupin Ltd Bajaj Auto Ltd Axis Bank Ltd Trent Ltd ITC Ltd Top 10 Underweight Stocks Company HDFC BANK LTD Reliance Industries Ltd ICICI Bank Ltd Infosys Ltd TCS Bharti Airtel Ltd Kotak Mahindra Bank Ltd Hindustan Unilever Ltd State Bank Of India Bajaj Finance Ltd Fund 0.75 0.90 8.07 9.70 165.00 Benchmark 1.00 -- 9.57 7.20 -- % to NAV Act WI (%) 5.03 4.75 3.39 3.26 5.63 2.83 3.06 4.82 2.84 5.42 % to NAV -- -- -- -- -- -- -- -- -- -- Act WI (%) -9.49 -6.61 -5.28 -4.19 -2.89 -2.06 -2.03 -1.83 -1.75 -1.60 Beta Sharpe Ratio (%) Standard Deviation (%) Treynor Ratio (%) PTR (Annual) (%) 4.03 3.73 2.76 2.65 2.60 2.58 2.50 2.36 2.34 2.31 Data as on November 30, 2023 Mutual Fund Investments are subject to market risks, read all scheme related documents carefully
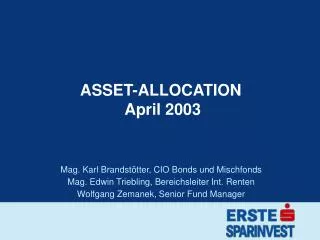
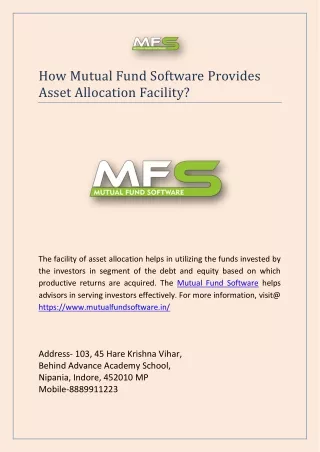
UTI Multi Asset Allocation Fund An open ended scheme investing in equity, debt and Gold ETFs. Dec 2023 3 Months Rolling Returns (3 Years) UTI Multi Asset Allocation Fund - Growth S&P BSE 200 TRI, CRISIL Composite Bond Fund Index & Price of Gold 20 Rolling Returns (in %) 9.3 8.2 7.7 7.4 10 6.6 6.3 5.7 5.4 5.1 5.0 4.4 4.3 3.3 3.0 2.9 2.8 2.7 1.3 0 -0.5 -1.0 -1.5 -1.6 -4.2 -4.7 -10 Feb-21 May-21 Aug-21 Nov-21 Feb-22 May-22 Aug-22 Nov-22 Feb-23 May-23 Aug-23 Nov-23 Rolling Returns of 3 months have been calculated over a rolling freqency of 3 months over the last 3 years Calendar Year Performance (%) Fund/Benchmark UTI Multi Asset Allocation Fund - Growth S&P BSE 200 TRI, CRISIL Composite Bond Index & Price of Gold Nifty 50 TRI* * Additional Benchmark 2016 7.3 2017 17.1 2018 -0.5 2019 3.9 2020 13.1 2021 11.8 2022 4.4 2023 (YTD) 22.8 8.1 23.5 3.0 12.0 23.7 13.9 5.4 12.6 4.4 30.3 4.6 13.5 16.1 25.6 5.7 12.4 Rolling Returns (15 Years) Minimum Maximum Average 90 77 Rolling Returns (in %) 60 28 10 8 30 9 8 18 13 5 0 -1 -5 -30 -21 1 Year 3 Years 5 Years 10 Years Investment Horizon Instances of -ve Returns Instances of Returns>8% 1% 52% 18% 52% 0% 49% 0% 40% Rolling Returns with daily frequency of UTI Multi Asset Allocation Fund - Growth at difference time frame as mentioned above. CAGR –Compounded Annual Growth Rate. Data period: November 30, 2008 to November 30, 2023. Different plans have a different expense structure. The performance details provided herein are of regular plan. Past performance may or may not be sustained in future. Cumulative Performance Since Inception (Growth of ₹ 10,000) UTI Multi Asset Allocation Fund - Growth S&P BSE 200 TRI, CRISIL Composite Bond Fund Index & Price of Gold 80,000 ₹56,394 UTI Multi Asset Allocation Fund - NAV rebased to ₹ 10,000 60,000 ₹76,419 S&P BSE 200 TRI, CRISIL Composite Bond Fund Index & Price of Gold 40,000 20,000 0 Dec-08 Dec-11 Dec-14 Dec-17 Dec-20 Nov-23 Fund Performance Vs Benchmark Growth of ₹ 10,000/- Fund Performance Vs Benchmark B: S&P BSE 200 TRI, CRISIL Composite Bond Index & Price of Gold (₹) 11,080 14,854 19,000 76,419 B: S&P BSE 200 TRI, CRISIL Composite Bond Index & Price of Gold (%) Period Scheme Returns (%) AB: Nifty 50 TRI (%) Scheme Returns (₹) AB: Nifty 50 TRI (₹) 10.80 14.10 13.69 14.48 1 Year 3 Years 5 Years Since Inception^ B - Benchmark, AB - Additional Benchmark, TRI - Total Return Index 22.89 14.14 11.18 12.19 8.47 17.17 14.45 15.86 12,289 14,870 16,993 56,394 10,847 16,086 19,644 91,508 SIP Performance (Investment of ₹ 10,000 per month) Fund Performance Vs Benchmark SIP of ₹ 10,000 per month B: S&P BSE 200 TRI, CRISIL Composite Bond Index & Price of Gold (₹) 130,996 429,270 852,794 1,340,041 2,306,672 4,789,467 Investment Amount (₹) B: S&P BSE 200 TRI, CRISIL Composite Bond Index & Price of Gold (%) SIP Investment Period Scheme Returns (%) AB: Nifty 50 TRI (%) Scheme Returns (₹) AB: Nifty 50 TRI (₹) 17.48 11.78 14.05 13.12 12.55 12.21 120,000 360,000 600,000 840,000 1,200,000 1,790,000 31.41 16.53 14.44 11.83 10.21 9.68 17.59 13.06 16.13 14.76 13.73 13.21 139,411 459,497 861,092 1,279,825 2,036,847 3,870,857 131,066 437,278 897,682 1,420,893 2,457,064 5,216,639 1 Year 3 Years 5 Years 7 Years 10 Years Since Inception@ B - Benchmark, AB - Additional Benchmark, TRI - Total Return Index Investment Horizon Who Should Invest? • Investors looking to create long term wealth Ideal for investment with a time horizon of preferably, 3 years and above Investment through Systematic Investment Plan (SIP) may help in tackling the volatility of broader equity market • • Investors looking for Investment in equity, debt and Gold ETFs with a minimum • Note: Returns < 1 Year are Absolute and ≥ 1 Year are Compunded Annualised; Source: MFI Explorer Note: @:Systematic Investment Plan (SIP) returns are worked out assuming investment of ₹ 10,000/- every month at NAV per unit of the scheme as on the first working day for the respective time periods. The loads have not been taken into account.Since Inception returns for SIP is calculated from 01-Dec-08. Past performance may or may not be sustained in future. All data points pertains to UTI Multi Asset Allocation Fund - Growth; ^Since Inception returns for fund performance is calculated from 19-Nov-08; Different plans have a different expense structure. The performance details provided herein are of regular plan. For performance of other funds managed by the fund manager, please refer Product Label This Product is suitable for investors who are seeking*: (i) Long term capital appreciation Fund: UTI Multi Asset Allocation Fund - Growth (ii)Investment in equity, debt and Gold ETFs with a minimum allocation of 10% in each asset class Benchmark: S&P BSE 200 TRI, CRISIL Composite Bond Fund Index & Price of Gold * Investors should consult their financial advisor if in doubt about whether the product is suitable for them. https://bit.ly/UTIMFFundPerformanceReportNov2023 Distributed by Disclaimers: The information on this document is provided for information purposes only. It does not constitute any offer, recommendation or solicitation to any person to enter into any transaction or adopt any hedging, trading or investment strategy, nor does it constitute any prediction of likely future movements in rates or prices or any representation that any such future movements will not exceed those shown in any illustration. Users of this document should seek advice regarding the appropriateness of investing in any securities, financial instruments or investment strategies referred to on this document and should understand that statements regarding future prospects may not be realized. The recipient of this material is solely responsible for any action taken based on this material. Opinions, projections and estimates are subject to change without notice. UTI AMC Ltd is not an investment adviser, and is not purporting to provide you with investment, legal or tax advice. UTI AMC Ltd or UTI Mutual Fund (acting through UTI Trustee Company Pvt. Ltd) accepts no liability and will not be liable for any loss or damage arising directly or indirectly (including special, incidental or consequential loss or damage) from your use of this document, howsoever arising, and including any loss, damage or expense arising from, but not limited to, any defect, error, imperfection, fault, mistake or inaccuracy with this document, its contents or associated services, or due to any unavailability of the document or any part thereof or any contents or associated services. Mutual Fund Investments are subject to market risks, read all scheme related documents carefully Data as on November 30, 2023