Download
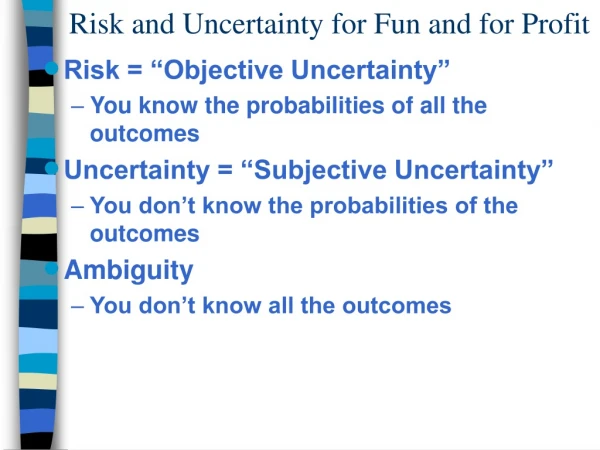
1 / 55
550 likes | 780 Views
Extreme Metrics Analysis for Fun and Profit. Paul Below. Agenda. Statistical Thinking Metrics Use: Reporting and Analysis Measuring Process Improvement Surveys and Sampling Organizational Measures. Agenda. Statistical Thinking.

E N D
Extreme Metrics Analysis for Fun and Profit Paul Below
Agenda • Statistical Thinking • Metrics Use: Reporting and Analysis • Measuring Process Improvement • Surveys and Sampling • Organizational Measures
Agenda Statistical Thinking “Experiments should be reproducible. They should all fail in the same way.”
Statistical Thinking • You already use it, at home and at work • We generalize in everyday thinking • Often, our generalizations or predictions are wrong
Uses for Statistics • Summarize our experiences so others can understand • Use information to make predictions or estimates • Goal is to do this more precisely than we would in everyday conversation
Listen for Questions • We are not used to using numbers in professional lives • “What does this mean?” • “What should we do with this?” • We need to take advantage of our past experience
Statistical Thinking is more important than methods or technology Analysis is iterative, not one shot Data Induction I I D D Deduction Model Learning (Modification of Shewhart/Deming cycle by George Box, 2000 Deming lecture, Statistics for Discovery)
Agenda Metrics Use: Reporting and Analysis "It ain't so much the things we don't know that get us in trouble. It's the things we know that ain't so." Artemus Ward, 19th Century American Humorist
Purpose of Metrics • The purpose of metrics is to take action. All types of analysis and reporting have the same high-level goal: to provide information to people who will act upon that information and thereby benefit. • Metrics offer a means to describe an activity in a quantitative form that would allow a knowledgeable person to make rational decisions. However, • Good statistical inference on bad data is no help. • Bad statistical analysis, even on the right variable, is still bad statistics.
Therefore… • Metrics use requires implemented processes for: • metrics collection, • reporting requirements determination, • metrics analysis, and • metrics reporting.
Types of Metrics Use “You go to your tailor for a suit of clothes and the first thing that he does is make some measurements; you go to your physician because you are ill and the first thing he does is make some measurements. The objects of making measurements in these two cases are different. They typify the two general objects of making measurements. They are: (a) To obtain quantitative information (b) To obtain a causal explanation of observed phenomena.” Walter Shewhart
The Four Types of Analysis • Ad hoc: Answer specific questions, usually in a short time frame. Example: Sales support • Reporting: Generate predefined output (graphs, tables) and publish or disseminate to defined audience, either on demand or on regular schedule. • Analysis: Use statistics and statistical thinking to investigate questions and reach conclusions. The questions are usually analytical (e.g., “Why?” or “How many will there be?”) in nature. • Data Mining: Data mining starts with data definition and cleansing, followed by automated knowledge extraction from historical data. Finally, analysis and expert review of the results is required.
Body of Knowledge (suggestions) • Reporting • Database query languages, distributed databases, query tools, graphical techniques, OLAP, Six Sigma Green Belt (or Black Belt), Goal-Question-Metric • Analysis • Statistics and statistical thinking, graphical techniques, database query languages, Six Sigma black belt, CSQE, CSQA • Data Mining • Data mining, OLAP, data warehousing, statistics
Analysis Decision Tree Type of Question? Enumerative Analytical Factors Analyzed: Few Many One Time? Yes No Ad hoc Reporting Analysis Data Mining and Analysis
Extreme Analysis • Short deadlines, small releases • Overall high level purposes defined up front, prior to analysis start • Specific questions prioritized prior to analysis start • Iterative approach with frequent stakeholder reviews to obtain interim feedback and new direction • Peer synergy, metrics analysts work in pairs. • Advanced query and analysis tools, saved work can be reused in future engagements • Data warehousing techniques, combining data from multiple sources where possible • Data cleansing done prior to analysis start (as much as possible) • Collective ownership of the results
Extreme Analysis Tips Produce clean graphs and tables displaying important information. These can be used by various people for multiple purposes. Explanations should be clear, organization should make it easy to find information of interest. However, It takes too long to analyze everything -- we cannot expect to produce interpretations for every graph we produce. And even when we do, the results are superficial because we don't have time to dig into everything. "Special analysis", where we focus in on one topic at a time, and study it in depth, is a good idea. Both because we can complete it in a reasonable time, and also because the result should be something of use to the audience. Therefore, ongoing feedback from the audience is crucial to obtaining useful results
Agenda Measuring Process Improvement “Is there any way that the data can show improvement when things aren’t improving?” -- Robert Grady
Measuring Process Improvement • Analysis can determine if a perceived difference could be attributed to random variation • Inferential techniques are commonly used in other fields, we have used them in software engineering for years • This is an overview, not a training class
Expand our Set of Techniques Metrics are used for: • Benchmarking • Process improvement • Prediction and trend analysis • Business decisions • …all of which require confidence analysis!
Is This a Meaningful Difference? 2.0 1.5 1.0 0.5 0 1 2 3 CMM Maturity Level Relative Performance
Pressure to Product Results • Why doesn’t the data show improvement? • “Take another sample!” • Good inference on bad data is no help “If you torture the data long enough, it will confess.” -- Ronald Coase
Types of Studies Anecdote Case Study Quasi-experimental Experiment • Anecdote: “I heard it worked once”, cargo cult mentality • Case Study: some internal validity • Quasi-Experiment: can demonstrate external validity • Experiment: can be repeated, need to be carefully designed and controlled
Attributes of Experiments Subject Treatment Reaction • Random Assignment • Blocked and Unblocked • Single Factor and Multi Factor • Census or Sample • Double Blind • When you really have to prove causation (can be expensive)
Limitations of Retrospective Studies • No pretest, we use previous data from similar past projects • No random assignment possible • No control group • Cannot custom design metrics (have to use what you have)
Quasi-Experimental Designs • There are many variations • Common theme is to increase internal validity through reasonable comparisons between groups • Useful when formal experiment is not possible • Can address some limitations of retrospective studies
Causation in Absence of Experiment • Strength and consistency of the association • Temporal relationship • Non-spuriousness • Theoretical adequacy
What Should We Look For? Are the Conclusions Warranted? • Some information to accompany claims: • measure of variation • sample size • confidence intervals • data collection methods used • sources • analysis methods
Decision Without Analysis • Conclusions may be wrong or misleading • Observed effects tend to be unexplainable • Statistics allows us to make honest, verifiable conclusions from data
Two Techniques We Use Frequently • Inference for difference between two means • Works for quantitative variables • Compute confidence interval for the difference between the means • Inference for two-way tables • Works for categorical variables • Compare actual and expected counts
Quantitative Variables Comparison of means of quartiles 2 and 4 yields p value of 88.2%, not a significant difference at 95% level)
Categorical Variables P value is approximately 50%
Categorical Variables P value is greater than 99.9%
Expressing the Results “in English” • “We are 95% certain that the difference in average productivity for these two project types is between 11 and 21 FP/PM.” • “Some project types have a greater likelihood of cancellation than other types, we would be unlikely to see these results by chance.”
What if... • Current data is insufficient • Experiment can not be done • Direct observation or 100% collection cannot be done • or, lower level information is needed?
Agenda Surveys and Samples In a scientific survey every person in the population has some known positive probability of being selected.
What is a Survey? • A way to gather information about a population from a sample of that population • Varying purposes • Different ways: • telephone • mail • internet • in person
What is a Sample? • Representative fraction of the population • Random selection • Can reliably project to the larger population
What is a Margin of Error? • An estimate from a survey is unlikely to exactly equal to quantity of interest • Sampling error means results differ from a target population due to “luck of the draw” • Margin of error depends on sample size and sample design
What Makes a Sample Unrepresentative? • Subjective or arbitrary selection • Respondents are volunteers • Questionable intent
How Large Should the Sample Be? • What do you want to learn? • How reliable must the result be? • Size of population is not important • 1500 people is reliable enough for entire U.S. • How large CAN it be?
“Dewey Defeats Truman” • Prominent example of a poorly conceived survey • 1948 pre-election poll • Main flaw: non-representative sample • 2000 election: methods not modified to new situation
Is Flawed Sample the Only Type of Problem That Happens? • Non-response • Measurement difficulties • Design problems, leading questions • Analysis problems
Some Remedies • Stratify sample • Adjust for incomplete coverage • Maximize response rate • Test questions for • clarity • objectivity • Train interviewers
Agenda Organizational Measures “Whether measurement is intended to motivate or to provide information, or both, turns out to be very important.” -- Robert Austin
Dysfunctional Measures • Disconnect between measure and goal • Can one get worse while the other gets better? • Is one measure used for two incompatible goals? • The two general types of measurement are...
Measurement in Organizations • Motivational Measurements • intended to affect the people being measured, to provoke greater expenditure of effort in pursuit of org’s goals • Informational Measurements • logistical, status, or research information, provide insight to provide short term management and long term improvement
Informational Measurements • Process Refinement Measurements • reveals detailed structure of processes • Coordination Measurements • logistical purpose
Mixed Measurements The desire to be viewed favorably provides an incentive for people being measured to tailor, supplement, repackage, or censor information that flows upward. • “Dashboard” concept is incomplete • We have Gremlins