Download
1 / 3

E N D
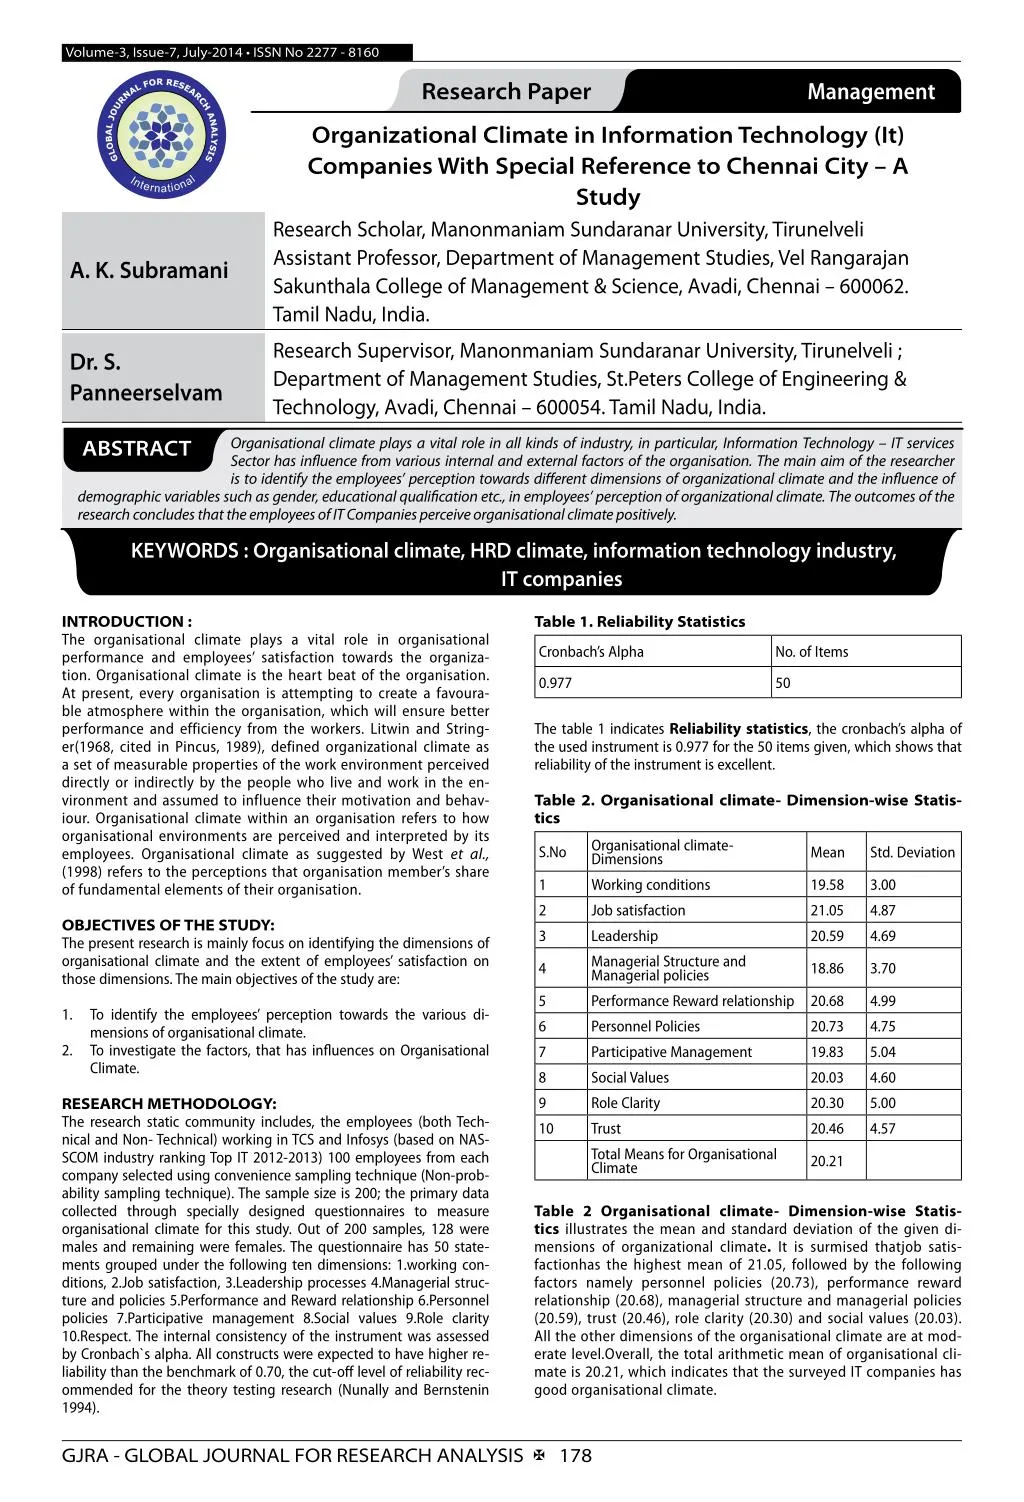
Volume-3, Issue-7, July-2014 • ISSN No 2277 - 8160 Research Paper Management Organizational Climate in Information Technology (It) Companies With Special Reference to Chennai City – A Study Research Scholar, Manonmaniam Sundaranar University, Tirunelveli Assistant Professor, Department of Management Studies, Vel Rangarajan Sakunthala College of Management & Science, Avadi, Chennai – 600062. Tamil Nadu, India. A. K. Subramani Research Supervisor, Manonmaniam Sundaranar University, Tirunelveli ; Department of Management Studies, St.Peters College of Engineering & Technology, Avadi, Chennai – 600054. Tamil Nadu, India. Dr. S. Panneerselvam Organisational climate plays a vital role in all kinds of industry, in particular, Information Technology – IT services Sector has influence from various internal and external factors of the organisation. The main aim of the researcher is to identify the employees’ perception towards different dimensions of organizational climate and the influence of demographic variables such as gender, educational qualification etc., in employees’ perception of organizational climate. The outcomes of the research concludes that the employees of IT Companies perceive organisational climate positively. ABSTRACT KEYWORDS : Organisational climate, HRD climate, information technology industry, IT companies INTRODUCTION : The organisational climate plays a vital role in organisational performance and employees’ satisfaction towards the organiza- tion. Organisational climate is the heart beat of the organisation. At present, every organisation is attempting to create a favoura- ble atmosphere within the organisation, which will ensure better performance and efficiency from the workers. Litwin and String- er(1968, cited in Pincus, 1989), defined organizational climate as a set of measurable properties of the work environment perceived directly or indirectly by the people who live and work in the en- vironment and assumed to influence their motivation and behav- iour. Organisational climate within an organisation refers to how organisational environments are perceived and interpreted by its employees. Organisational climate as suggested by West et al., (1998) refers to the perceptions that organisation member’s share of fundamental elements of their organisation. Table 1. Reliability Statistics Cronbach’s Alpha No. of Items 0.977 50 The table 1 indicates Reliability statistics, the cronbach’s alpha of the used instrument is 0.977 for the 50 items given, which shows that reliability of the instrument is excellent. Table 2. Organisational climate- Dimension-wise Statis- tics Organisational climate- Dimensions Working conditions Job satisfaction Leadership Managerial Structure and Managerial policies Performance Reward relationship Personnel Policies Participative Management Social Values Role Clarity Trust Total Means for Organisational Climate S.No Mean Std. Deviation 1 2 3 19.58 21.05 20.59 3.00 4.87 4.69 OBJECTIVES OF THE STUDY: The present research is mainly focus on identifying the dimensions of organisational climate and the extent of employees’ satisfaction on those dimensions. The main objectives of the study are: 4 18.86 3.70 5 6 7 8 9 10 20.68 20.73 19.83 20.03 20.30 20.46 4.99 4.75 5.04 4.60 5.00 4.57 1. To identify the employees’ perception towards the various di- mensions of organisational climate. 2. To investigate the factors, that has influences on Organisational Climate. RESEARCH METHODOLOGY: The research static community includes, the employees (both Tech- nical and Non- Technical) working in TCS and Infosys (based on NAS- SCOM industry ranking Top IT 2012-2013) 100 employees from each company selected using convenience sampling technique (Non-prob- ability sampling technique). The sample size is 200; the primary data collected through specially designed questionnaires to measure organisational climate for this study. Out of 200 samples, 128 were males and remaining were females. The questionnaire has 50 state- ments grouped under the following ten dimensions: 1.working con- ditions, 2.Job satisfaction, 3.Leadership processes 4.Managerial struc- ture and policies 5.Performance and Reward relationship 6.Personnel policies 7.Participative management 8.Social values 9.Role clarity 10.Respect. The internal consistency of the instrument was assessed by Cronbach`s alpha. All constructs were expected to have higher re- liability than the benchmark of 0.70, the cut-off level of reliability rec- ommended for the theory testing research (Nunally and Bernstenin 1994). 20.21 Table 2Organisational climate- Dimension-wise Statis- tics illustrates the mean and standard deviation of the given di- mensions of organizational climate. It is surmised thatjob satis- factionhas the highest mean of 21.05, followed by the following factors namely personnel policies (20.73), performance reward relationship (20.68), managerial structure and managerial policies (20.59), trust (20.46), role clarity (20.30) and social values (20.03). All the other dimensions of the organisational climate are at mod- erate level.Overall, the total arithmetic mean of organisational cli- mate is 20.21, which indicates that the surveyed IT companies has good organisational climate. GJRA - GLOBAL JOURNAL FOR RESEARCH ANALYSISX 178
Volume-3, Issue-7, July-2014 • ISSN No 2277 - 8160 DATA ANALYSIS AND DISCUSSIONS Table 3. Individual Means – Working Conditions Table 6. Individual Means – Leadership S.No. Leadership Mean S.D S.No. Working conditions Mean S.D I feel the company always identifies and encourages the leadership qualities to develop future leaders for the organisation I gets the support of my superior when there is a problems at the work place I have access to my superior (HR Manager /Team Leader / Project Manager) for my personal / project/ work matters of importance My organisation provides safe and healthy working conditions to its employees. 1 3.25 1.271 1 4.52 0.838 My company offers flexible working hours for the convenience of its employees to have work Life balance. 2 3.72 1.244 2 3.18 1.380 My organisation provides tables and chairs designed with proper ergonomics for the comfort of employees to concentrate on work. 3 4.13 1.101 3 4.26 1.019 My innovative ideas, concepts has been accepted and appreciated by immediate superior immediately. Our management replaces computers, printers and other network and communication devices before it becomes obsolete. 4 3.66 1.302 4 3.77 1.332 My immediate superior and Senior executives always encourages and gives feedback about my performance 5 I receive all information to do my work. 3.84 1.411 5 4.10 1.246 Over all Mean 19.58 3.005 From the table no 3, Individual Means – Working Conditions, it is interpreted that the respondents opined that they have safe and healthy environment have the highest mean of 4.52, followed by comfort ability of furniture with the mean of 4.26. The other elements of working environment are at moderate level. Flexible working hours in the company has lowest mean of 3.18 Over all Mean 18.86 3.70 Table no 6. Individual Means–Leadership indicates that, the mean values for leadership measures are all above mean 3.2, in particular access to the managers shows good sign with the mean of 4.13 and encouragement and feedback by superiors having the mean of 4.10. Table 4. Individual Means – Job Satisfaction Table 7. Performance Reward Relationship S.No. Job satisfaction Mean S.D S.No Performance Reward Relationship Mean S.D We have better remuneration policy (Pay scale and perks) when compared with many other organisation in IT Industry 1 4.38 0.927 Employees who contribute to the company’s productivity and efficiency an invariably appreciated with due award here 1 4.17 1.096 Adequacy of job security is there in my organisation 2 3.81 1.489 Periodic Performance Appraisal of employees has been done by the immediate superiors / HR Executives/ Top Level Executives, the results and rating are communicated to the employees. 2 4.24 1.095 My organisation has career advancement channels for all kinds of employees 3 4.22 1.085 My job provides me with the opportunity to learn new skills and develop new talents Employees here rewarded in proportion to the excellence of their performance 4 4.19 1.127 3 4.01 1.232 5 Over all I am satisfied with my job 4.46 0.945 Performance appraisal of employees are transparent and done in impartial manner 4 4.14 1.199 Over all Mean 21.05 4.87 In this organisation there is a direct relationship between performance and rewards 5 4.12 1.148 From Table 4. Individual Means – Job Satisfaction, it is concluded that majority of the respondents were satisfied with their job (Mean 4.46). Most of the respondents have agreed that they are satisfied with pay and remuneration policy of the organization with the mean value of 4.38. Over all Mean 20.68 4.99 Performance Reward Relationship (Table 7) elements also shows the highest mean of 4.24. All the elements of performance reward rela- tionship are having the mean of 4.01 and above. Table 5. Managerial Structure and Managerial Policies Other Findings : • The employees of the company were very much satisfied with the personnel policies (Table 8) of the IT companies. • Participative Management, the respondents opined that the im- mediate superior consult with them during goal setting with the mean of 3.88, which is comparatively lesser than mean of other variables. • Social values show the variation of the means from 3.43 to 4.41, the respondents were less agreement with the statements, such as “organization gives special attention in fulfilling the social needs of the workers, thereby increase their social values”, and “Our management encourages its members to take part in pro- fessional clubs, e-forums”, with the mean values of 3.45 and 3.85 respectively. • Role clarity, the respondents were strongly agreed with role clari- ty in the organisation and have the overall mean of 20.30 • Most of the respondents were having trust on their colleagues, and they felt that their colleagues were also having the trust on them. CONCLUSION: This research is attempt to find out the organisational climate of IT companies in Chennai City. In this research, the researcher found that the employees of IT companies were highly satisfied in the taken di- mensions of organisational climate, except in few such as Managerial Structure and Managerial policies, participative management, work- S.No Managerial Structure and Managerial Policies Mean S.D Excessive procedure and unnecessary detailed information are avoided in this organisation 1 4.15 1.106 Here the people are always well informed about the matters going around them 2 3.81 1.292 My Organisation always gives importance on Quality assurance, Client satisfaction and continuous improvement in the Software Development processes and its deliverables 3 4.38 1.086 My organisation has good vertical and horizontal communication channels. 4 4.18 1.106 I can meet my Project Manager /CEO / Managing Director/ any other Top Level Executives at any time 5 4.07 1.205 Over all Mean 20.59 4.69 The respondents’ satisfaction towards Managerial Structure and Man- agerial policies (Table 5) having the overall Mean value of 20.59. In particular, the importance given by the company quality assurance and client satisfaction has highest mean of 4.38, which is followed by communication channels of the company was mean 4.18. GJRA - GLOBAL JOURNAL FOR RESEARCH ANALYSISX 179
Volume-3, Issue-7, July-2014 • ISSN No 2277 - 8160 ing conditions and Social values in which mean values slightly lower than other variables. The IT companies may give some more impor- tance to provide flexible work timings to ensure work-life balance, ad- equate job security, work committees to discuss day-to-day problems, and allowing employees to take part in social service and cultural pro- grammes. REFERENCES 1. Jones, A, & James L(1999), Psychological climate: Dimensions and relationships of individual and aggregated work environment perception. Organizational Behaviour and Human Performance, 23, Pp.201. | 2. James, L, & Jones A(2007), Organizational Climate: A review of theory and research. Psychological Bulletin, 12, Pp.1096. | 3. Brian Hunt and Toni Ivergard, (2007). “Organisational Climate and Work Place Efficiency”, Public Management Review, Vol.9, No.1. | 4. Gordon and Ditomaso (1992), Predicting Corporate performance from organizational climate, Journal of Management studies, Vol 29(6), Pp.783. | 5. Peter Kangis, Gordon, D. Williams, S. (2000). “Organisational Climate and Corporate Performance: An Empirical Investigation”, Management Decision, Vol.38, No.8. | 6. Robbins ,S.P., (2001). Organizational Behaviour, New Delhi. Prentice Hall ,Inc, | 7. Padmakali Mishra and Gopal Bhardwaj (2002), “HRD Climate: An Empirical Study Among Private Sector Managers”, published in Indian Journal Of Industrial Relation, IJIR, Vol. 38, No. 1, July. | 8. Muchinsky P (2007), Organizational communication: Relationship to organizational Climate and job satisfaction. Academy of Management Journal, Pp.607. | 9. Prashant Mishra, UpinderDhar and Santosh Dhar (1999), “Job satisfaction as correlated of HRD Climate: An Empirical Study”, Indian Journal of Training & Development. | 10. Mathew, J. (2008). Organisational Climate in Relation to Leader Behaviour and Business Strategy in IT Industry, Unpublished Ph.D thesis submitted to Bharthidasan University. | GJRA - GLOBAL JOURNAL FOR RESEARCH ANALYSISX 180