Download
1 / 10
100 likes | 126 Views
An extractive colorimetric method has been developed for estimation of Oxybutynin chloride in its tablet form.<br>Bromothymol blue indicator was used as the coloring agent, and a straw yellow color solution was formed in the<br>presence of acidic medium after extracting the drug with chloroform. The solution absorbance was measured at 414<br>nm. The linearity range was in the range of 2.5-12.5 µg/ml. The validation of the new proposed method was carried<br>out on various parameters like linearity, accuracy, precision, selectivity, specificity, robustness, and ruggedness,<br>LOD, LOQ.<br>

E N D
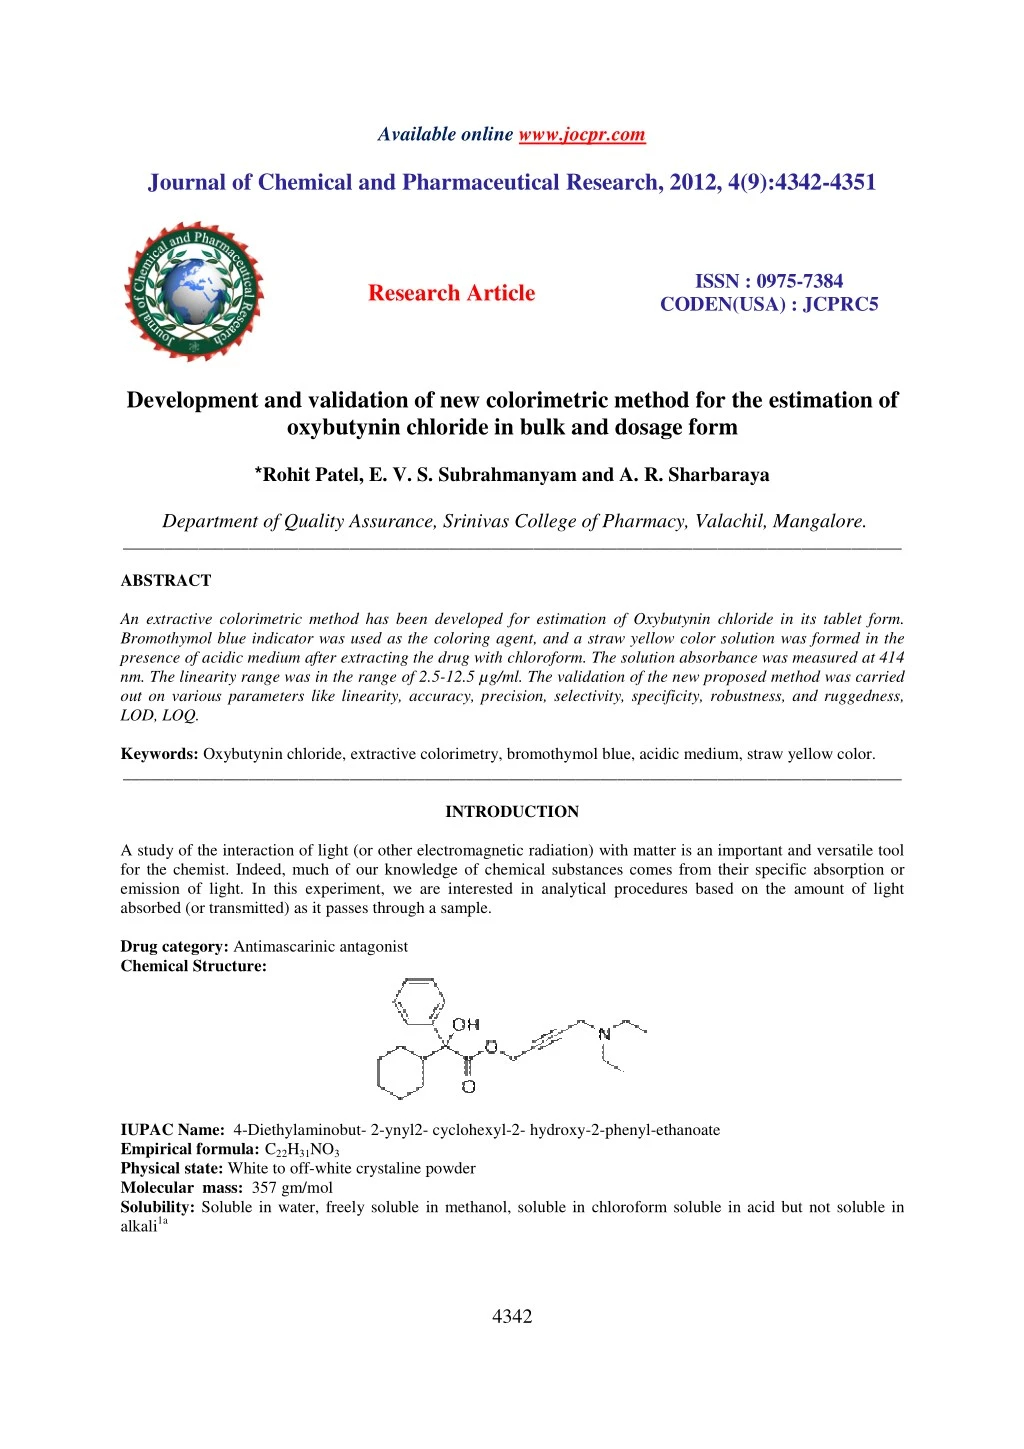
Available online www.jocpr.com Journal of Chemical and Pharmaceutical Research, 2012, 4(9):4342-4351 ISSN : 0975-7384 CODEN(USA) : JCPRC5 Research Article Development and validation of new colorimetric method for the estimation of oxybutynin chloride in bulk and dosage form *Rohit Patel, E. V. S. Subrahmanyam and A. R. Sharbaraya Department of Quality Assurance, Srinivas College of Pharmacy, Valachil, Mangalore. _____________________________________________________________________________________________ ABSTRACT An extractive colorimetric method has been developed for estimation of Oxybutynin chloride in its tablet form. Bromothymol blue indicator was used as the coloring agent, and a straw yellow color solution was formed in the presence of acidic medium after extracting the drug with chloroform. The solution absorbance was measured at 414 nm. The linearity range was in the range of 2.5-12.5 µg/ml. The validation of the new proposed method was carried out on various parameters like linearity, accuracy, precision, selectivity, specificity, robustness, and ruggedness, LOD, LOQ. Keywords: Oxybutynin chloride, extractive colorimetry, bromothymol blue, acidic medium, straw yellow color. _____________________________________________________________________________________________ INTRODUCTION A study of the interaction of light (or other electromagnetic radiation) with matter is an important and versatile tool for the chemist. Indeed, much of our knowledge of chemical substances comes from their specific absorption or emission of light. In this experiment, we are interested in analytical procedures based on the amount of light absorbed (or transmitted) as it passes through a sample. Drug category: Antimascarinic antagonist Chemical Structure: IUPAC Name: 4-Diethylaminobut- 2-ynyl2- cyclohexyl-2- hydroxy-2-phenyl-ethanoate Empirical formula:C22H31NO3 Physical state: White to off-white crystaline powder Molecular mass: 357 gm/mol Solubility: Soluble in water, freely soluble in methanol, soluble in chloroform soluble in acid but not soluble in alkali1a 4342
Rohit Patel et al ______________________________________________________________________________ J. Chem. Pharm. Res., 2012, 4(9):4342-4351 Oxybutynin is a belongs to class of antimuscarinic antagonist. Oxybutynin chloride relaxes bladder smooth muscle. In patients with conditions characterized by involuntary bladder contractions, cystometric studies have demonstrated that Oxybutynin chloride increases bladder (vesical) capacity, diminishes the frequency of uninhibited contractions of the detrusor muscle, and delays the initial desire to void. Oxybutynin chloride thus decreases urgency and the frequency of both incontinent episodes and voluntary urination1b. Mechanism of action: 1c Oxybutynin has a dual mechanism of action. Contraction of the smooth muscle of the bladder is stimulated by the release of acetylcholine by the nerves within the bladder and the attachment of the acetylcholine to receptors on the surface of the muscle cells. Oxybutynin suppresses involuntary contractions of the bladder's smooth muscle (spasms) by blocking the release of acetylcholine. This is called an "anticholinergic effect." Oxybutynin also directly relaxes the bladder's outer layer of muscle (the detrusor muscle). The aim of study is here to developed new colorimetric method. Analysis of the drug is important for development of drugs in their formulation and their use in therapies, for which we require standard analytical procedures. The USP has published specific guidelines for method 4validation for compound evaluation. USP defines eight steps for validation: Accuracy, Precision, Specificity, Limit of detection, Limit of quantitation , Linearity and range, Ruggedness, Robustness. As quality control process is not static some form of validation/verification should continue till the validated procedure is in use. It should not be a concept that once the method is initially developed and validated it is forgotten. EXPERIMENTAL SECTION 1.0 MATERIALS AND METHODS A extractive colorimetric method was developed for oxybutynin chloride by using bromothymol blue, chloroform and hydrochloric acid. 1.1 Experiment: Reagents and Chemicals: Oxybutyninchloride(pure drug), Chloroforn, bromothymol blue (BTB), 0.1 N HCL Instruments and Apparatus: Shimadzu, UV Spec-17 Jasco V-630 spectrophotometer, Essae weighing balance Apparatus and Glassware: Weighing Balance, Sonicator, Separating funnel (250 ml capacity) 100ml, 50ml, 10ml Volumetric Flask 10ml, 5ml, 1ml Pipettes, 500ml, 250ml Beakers Others: Spatulas, Whattman Filter Papers, 1.2 Preparation of 1st standard stock solution of Oxybutynin chloride (1mg/ml): Stock solution of Oxybutynin chloridewas prepared by accurately weighing 100mg of pure drug into a 100 ml volumetric flask and dissolved it in a 25 ml of chloroform and the volume was made up to the mark with chloroform to get a concentration of 1 mg/ml. 1.3 Preparation of 2nd standard stock solution of Oxybutynin chloride (50µg/ml): The2st standard stock solution ofOxybutynin chloridewas prepared by pipetting out 5 ml of the 1st standard stock solution into a 100 ml volumetric flask and the volume was made up to the mark with chloroform to get a concentration of 200µg/ml. 4343
Rohit Patel et al ______________________________________________________________________________ J. Chem. Pharm. Res., 2012, 4(9):4342-4351 1.4 Preparation of working standard solutions (5-25µg/ml): The working standard solution of Oxybutynin chloride was prepared by pipetting out 0, 1, 2, 3, 4, and 5 ml of 2nd standard stock solution in each 10 ml volumetric flask and the volume was made up to the mark with chloroform to get a concentration of 0, 5, 10, 15, 20, 25 µg/ml respectively. 1.5 Preparation of 0.1 N HCL 0.1 N HCl was prepared by pipetting out 0.85 ml of conc. HCL in 100 ml of volumetric flask and volume was made up to the mark with distilled water. The systematic study of the effect of the following variables was considered. 1.6 PRELIMINARY INVESTIGATION: A Cleaned and dried separating funnel capacity of 250 ml was taken. 10 ml of 0.1 N of HCl was added in each separating funnel. Into this 5 ml of the 0.04% of BTB was added.Then 5 ml of working standard solution containg 20 µg/ml was added in a separating funnel followed by 5 ml of chloroform was added to extract the drug from the mixture. Shake the funnels vigorously for 2 min. and then the reaction mixture was kept aside for 10 min for the clear separation of the phases and completion of reaction. A straw yellow colored chromogen was obtained. Corresponding reagent blank is prepared in the same manner omitting the drug in which no color was seen. 1.7 PARAMETER FIXATION: 1.7a Determination of λ max: An absorption maxima or λ max is the wavelength at which maximum absorption takes place. Determination of λ max helps to avoid any interfering impurities. The data obtained is shown in Fig 1 1.7b Stability of color: The influence of time for the maximum color development and stability of the colored species were studied. Procedure: A cleaned and dried separating funnel capacity of 250 ml was taken. 10 ml of 0.1 N of HCl was added in each separating funnel. Into this 5 ml of the 0.04% of BTB was added.Then 5 ml of working standard solution containg 0, 5, 10 µg/ml was added in a each separating funnel. 5 ml of chloroform was added in each separating funnel to extract the drug from the mixture. The funnels were shaken vigorously for 2 min. and then the reaction mixture was kept aside for 10 min for the clear separation of the phases and completion of reaction. Blank was prepared by same method omitting the drug. The chloroform layer was separated and the absorbance was measured against a reagent blank at a 414 nm, the results are recorded in Table 1 and graph is given in Fig 2 1.8 INVESTIGATION: 1.8a Effect of volume of BTB Indicator Procedure: Cleaned and dried 6 separating funnels capacity of 250 ml were taken. 10 ml of 0.1 N of HCl was added in each separating funnel. Into this 1, 2, 3, 4, 5 and 6 ml of the 0.04% of BTB was added in the in each separating funnel respectively .Then 5 ml of working standard solution containg 10 µg/ml was added in a each separating funnel. 5 ml of chloroform was added in each separating funnel to extract the drug from the mixture. The funnels were shaken vigorously for 2 min. and then the reaction mixture was kept aside for 10 min for the clear separation of the phases and completion of reaction. The chloroform layer was separated and the absorbance was measured against a reagent blank at a 414 nm, the results are recorded in Table 2 and graph is given in Fig 3 1.9 OPTICAL CHARACTERISTICS 1.9a Determination of Concentration range: For the spectrophotometric analysis, determination of the concentration range which obeys Beer-Lambert’s law is necessary for accuracy and reproducibility. 1.9b Preparation of standard curve: A standard curve was prepared by using pure Oxybutynin chloride in the conc. of 2.5-12.5µg/ml and selecting the absorption maxima at 414 nm. Procedure: Cleaned and dried 6 separating funnels capacity of 250 ml were taken. 10 ml of 0.1 N of HCl was added in each separating funnel. Into this 5 ml of the 0.04% of BTB was added.Then 5 ml of working standard solution containg 0, 5, 10, 15, 20, and 25 µg/ml was added in a each separating funnel. 5 ml of chloroform was added in 4344
Rohit Patel et al ______________________________________________________________________________ J. Chem. Pharm. Res., 2012, 4(9):4342-4351 each separating funnel to extract the drug from the mixture. The funnels were shaken vigorously for 2 min. and then the reaction mixture was kept aside for 10 min for the clear separation of the phases and completion of reaction. The chloroform layer was separated and the absorbance was measured against a reagent blank at a 414 nm, the results are recorded in Table 3 and graph is given in Fig 4 1.10 VALIDATION PARAMETERS : 1.10a LINEARITY Cleaned and dried 6 separating funnels capacity of 250 ml were taken. 10 ml of 0.1 N of HCl was added in each separating funnel. Into this 5 ml of the 0.04% of BTB was added.Then 5 ml of working standard solution containing 0, 5, 10, 15, 20, and 25 µg/ml was added in a each separating funnel. 5 ml of chloroform was then added to extract the drug from the mixture. The funnels were shaken vigorously for 2 min. and then the reaction mixture was kept aside for 10 min for the clear separation of the phases and completion of reaction. The chloroform layer was separated and the absorbance was measured against a reagent blank at a 414 nm, the results are recorded in Table 3 and graph is given in Fig 5 1.10b ACCURACY Recovery studies by the standard addition method were performed to study the accuracy of the proposed method. Pre-analysed samples of Oxybutynin chloride (5 µg/ml) were spiked with 80, 100 and 120 % extra Oxybutynin chloride standard and the mixture were analysed with the proposed method. Accuracy was assessed as the % Recovery at each concentration level. Data obtained from accuracy study are given in Table 4 1.10c REPEATABILITY : Final conc. of standard solutions of Oxybutynin chloride contained 2.5, 5, 7.5 10 and 12.5 µg/ml after extraction were prepared and a spectrum was recorded. Absorbance was measured at 414 nm against blank. The absorbance of the same concentration solution was measured six times and RSD was calculated. The data obtain are given in Table 5.Repeatability data of sample are given in Table 6 1.10d LIMIT OF DETECTION (LOD) & LIMIT OF QUANTITATION (LOQ): The limit of detection and quantification of the drugs were calculated with the standard deviation and slope. The results obtains were given in Table 7 σ= standard deviation s= slope of the calibration curve 1.10e SPECIFICITY AND SELECTIVITY : Table 8 Specificity and Selectivity study Study Oxybutynin chloride Specificity Selectivity Specific Selective 1.10f REPRODUCIBILITY : Reproducibility is assessed by means of an inter-laboratory trial. The absorbance readings were measured at 404nm at different laboratory using another spectrophotometer and the values obtained were evaluated using %RSD to verify their reproducibility. The data obtain are given in Table 9 1.10g INTRA AND INTER DAY PRECISION : Variation of results within the day (intra day), variation of results between days (inter day) were analyzed. 4345
Rohit Patel et al ______________________________________________________________________________ J. Chem. Pharm. Res., 2012, 4(9):4342-4351 Intraday precision was determined by analyzing Oxybutynin chloride for three times in the same day at 414 nm. Inter day precision was determined by analyzing the drug different day for three days at 414nm. The data obtain are given in Table 10 1.11 ANALYSIS OF MARKETED FORMULATION: Oxybutynin chloride was procured from the local market as tablets of strength 15 mg and marketed with brand name of TROPAN. Preparation of sample solution:- 20 tablets were weighed and powdered properly using a mortar and pestle. Powder weight equivalent to 100mg was weighed and transferred to 100ml of volumetric flask and dissolved in chloroform and filtered through whatmann filter paper in 100ml volumetric flask and made up to mark with same solvent which give the solution of 1000µg/ml conc. Further dilution was performed to get a concentration of 10µg/ml. A Cleaned and dried separating funnel capacity of 250 ml was taken. 10 ml of 0.1 N of HCl was added in each separating funnel. Into this 5 ml of the 0.04% of BTB was added.Then 5 ml sample solution was added in a separating funnel followed by 5 ml of chloroform was added to extract the drug from the mixture. Shake the funnels vigorously for 2 min. and then the reaction mixture was kept aside for 10 min for the clear separation of the phases and completion of reaction. The absorbance was taken at 414 nm. The amount oxybutynin chloride was calculated by using standard curve. The data was given in Table 11 RESULTS AND DISCUSSION In This method Oxybutynin chloride was based on the formation of yellow colored ion paired complex between Oxybutynin chloride and bromothymol blue by exctractive colorimetric method, which showed maximum absorbance at 414nm. Fig 1 λmax of Oxybutynin chloride Model : Band widthm : Response Measurement : No. of cycle : Sample λmax : SHIMADZU UV-Visible 1700. 2nm. Medium. 800-350 nm. 1. Oxybutynin chloride 414 nm : : 4346
Rohit Patel et al ______________________________________________________________________________ J. Chem. Pharm. Res., 2012, 4(9):4342-4351 A study was carried out for almost all the parameter established by ICH guidelines to validate the analytical methods for a solid pharmaceutical dosage forms i.e., Linearity, Accuracy, Precision, Robustness, Range and detection limit. The probable Colorimetric reactions are as follows: Table 1 Stability of coloured species of Oxybutynin chloride Final conc. Of the drug after extraction ( 5µg/ml) 1) 5 2) 5 3) 5 4) 5 5) 5 6) 5 7) 5 8) 5 9) 5 10) 5 Time (Minutes) Absorbance at 414 nm SL. No. 0 10 20 30 40 50 60 70 80 90 0.493 0.492 0.492 0.490 0.489 0.487 0.481 0.475 0.472 0.470 4347
Rohit Patel et al ______________________________________________________________________________ J. Chem. Pharm. Res., 2012, 4(9):4342-4351 Fig 2 Stability of colour Conclusion: The stability of colour was found to be stable for 1 hr. Table 2 Effect of volume of BTB indicator Volume of BTB Indicator (ml) 1 2 3 4 5 6 Sl. No. 1 2 3 4 5 6 Absorbance at 414 nm 0.123 0.178 0.247 0.359 0.491 0.427 Fig 3 Effect of volume of BTB indicator Conclusion The maximum absorbance was obtained at 5 ml of 0.04% of BTB 4348
Rohit Patel et al ______________________________________________________________________________ J. Chem. Pharm. Res., 2012, 4(9):4342-4351 Table 3 Absorbance of different conc. of Oxybutynin chloride obeying beer’s law Volume of the working standard solution added(0-25 µg/ml) Added 5ml (0 µg/ml) 0 5ml (5 µg/ml) 25 5ml (10 µg/ml) 50 5ml (15 µg/ml) 75 5ml (20 µg/ml) 100 5ml (25 µg/ml) 125 Final conc. Of the drug in the chloroform after extraction µg/5ml Sl. No. Concentration of the drug in 5 ml µg/5ml Absorbance at 414 nm 1) 2) 3) 4) 5) 6) 0 2.5 5 7.5 10 12.5 0 0.240 0.494 0.695 0.970 1.245 Fig 4 Absorbance of different concentration of Oxybutynin chloride obeying beer’s law CONCLUSION The linearity of the Oxybutynin chloride was found to be within the conc. range of 2.5 to 12.5 µg/ml Table 4 Determination of Accuracy Amt. of drug added OXB µg/ml 4 5 6 Amt. of sample OXB µg/ml 5 5 5 Amt. of drug recovered OXB µg/ml 3.92 5.01 5.98 % Recovery 0XB 98.08 100.2 99.72 Table 5 Repeatability data for Oxybutynin chloride at 414 nm 2.5 µg/ml 0.238 0.237 0.237 0.236 0.237 0.236 0.2368 0.000752 0.0032 0.32 5 7.5 µg/ml 0.698 0.697 0.695 0.696 0.695 0.694 0.6958 0.001471 0.0021 0.21 10 12.5 µg/ml 1.250 1.247 1.246 1.248 1.247 1.246 1.2473 0.001505 0.0012 0.12 Concentration µg/ml 0.495 0.495 0.493 0.492 0.493 0.493 0.4935 0.001224 0.0024 0.24 µg/ml 0.973 0.971 0.970 0.972 0.972 0.970 0.9713 0.001211 0.0012 0.12 Absorption Mean. Std. Dev. Coefficient variation % RSD n = 6 determination 4349
Rohit Patel et al ______________________________________________________________________________ J. Chem. Pharm. Res., 2012, 4(9):4342-4351 Table 6 Repeatability of sample application data for Oxybutynin chloride Oxybutynin chloride 5 µg/ml 0.490 0.488 0.487 0.485 0.488 0.489 0.4878 0.001722 0.0035 0.35 Concentration Absorption Mean. Std. Dev. Coefficient variation % RSD n = 6 determination Table 7 LOD AND LOQ LOD 0.0579 LOQ 0.174 Table 8 Specificity and Selectivity study Study Oxybutynin chloride Specificity Selectivity Specific Selective Table 9 Reproducibility data for Oxybutynin chloride at 414 nm Conc. µg/ml 5 Instrument 1 0.490 ± 0.00223 %RSD 0.45 * At 95% confidence interval Instrument 2 0.493 ± 0.00298 %RSD 0.66 Inference Not significant difference Table 10 Intra day and inter day precision data for Oxybutynin chloride at 414 nm Conc. µg/ml 5 10 15 Intra day (n=3) 0.241 ± 0.001147 0.498 ± 0.002430 0.697 ± 0.002915 CV 0.0047 0.0048 0.0042 %RSD 0.47 0.48 0.42 Inter day (n=3) 0.240 ± 0.001403 0.496 ± 0.002561 0.695 ± 0.003187 CV 0.0058 0.0051 0.0045 %RSD 0.58 0.51 0.45 Table 11 Assay Results of Marketed Formulation Actual concentration of OXB(µg/ml) 5 Amount obtained of OXB(µg/ml) 4.85 Formulation %OXB Tablet 97% CONCLUSION A extractive colorimetric method was developed with bromothymol blue the absorbance of chromogen was to be maximum at 414 nm against the corresponding reagent blank and proposed method makes use of simple reagent, which an ordinary analytical laboratory can afford. The method was found to be simple, precise, economic and less time consuming. The method has been statistically evaluated and results obtained were accurate, precise and insensitive and free from the interferences of other additives present in the formulation. The proposed Colorimetric methods can be used for determination of Oxybutynin chloride in tablets. 4350
Rohit Patel et al ______________________________________________________________________________ J. Chem. Pharm. Res., 2012, 4(9):4342-4351 Table 12 Summary of parameters of spectrophotometry Parameter λmax(nm) Beer’s law limits (µg/ml) Sandell’s sensitivity (µg.cm2/0.001 Au) Regression equation (y=a+bc) Slope (b) Intercept (a) Correlation coefficient (r2) Result 414 nm 2.5-12.5µg/ml 0.2767 b=0.098 a=0.008 0.998 1) At Level-1 (80%)=98.08 2) At Level-2 (100%)=100.2 3) At Level-3 (120%=)99.72 0.12 to 0.32 0.0579 0.174 Specific Selective 0.45 0.66 0.42-0.48 0.45-0.58 % recovery Repeatability (%RSD) Limit of Detection (µg/ml) Limit of Quantitation (µg/ml) Specificity Selectivity Reproducibility Instrument 1 (%RSD) Instrument 2 (%RSD) Precision (n=3) Intra day precision (%RSD) Inter day precision (%RSD) Acknowledgement The author wishes to thanks mates who helped me lot for my work. And how can I forget staff of Srinivas College of pharmacy, Mangalore who suggest me in all way. REFERENCES [1] (a)en.wikipedia.org/wiki/Oxybutynin (b) http://www.drugs.com/pro/oxybutynin.html (c)medicinenet,com/oxybutynin [2] K Shrikanth; KA Emmanuel; R Raju, Rasayan J of Chem. 2010,3(1),179-87 [3] VS Varma; AM Kaushal; S Garg, J of pharmaceutical and biological analysis2004,36(3),669-74 [4] NE Wagieh; MA Hegazy; M Abdelkawy; EA Abdelaleem, Pak J Pharm Sci. Oct 2008,21(4),366-9. [5]R Massoud; G Federici; S Casciani, J Chromatogr B Biomed Sci Appl. Oct 1999,734(1),163-7 [6] A Suman; B Naveen; MV Ramana, Pharmacophore 2011, Vol. 2(2), 156-162 [7] ICH, Q2A Text on validation of analytical procedures, Oct, 1994. [8] ICH, Q3B Validation of analytical procedures: methodology, Nov, 1996. 4351