Download
1 / 10
100 likes | 111 Views
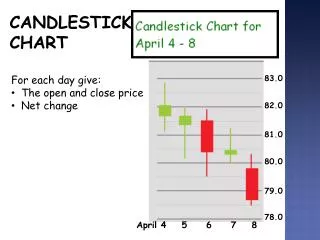
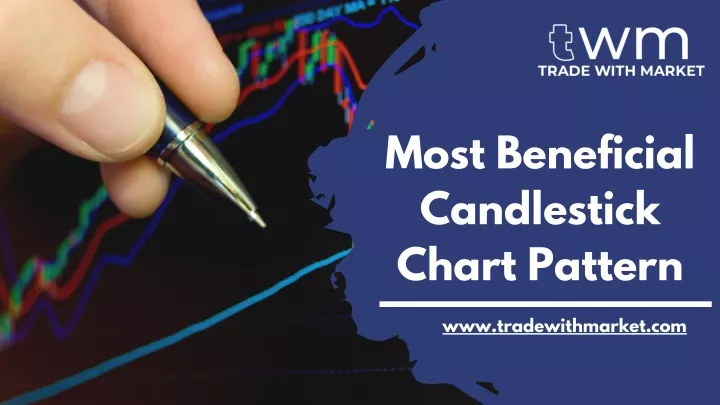
A candlestick chart is a financial chart that displays the price movement of a security, derivative, or currency over time. It consists of a series of vertical bars that represent the price range over a certain time, with a thin horizontal line extending to the right that represents the closing price for the period. The body of the bar is filled in if the closing price is lower than the opening price (a bearish candlestick) or left blank if the closing price is higher (a bullish candlestick). For more information, visit our website: https://tradewithmarket.com/

E N D
Most Beneficial Candlestick Chart Pattern www.tradewithmarket.com
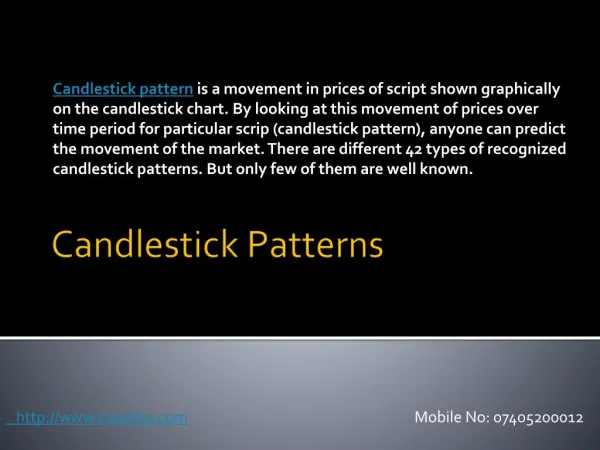
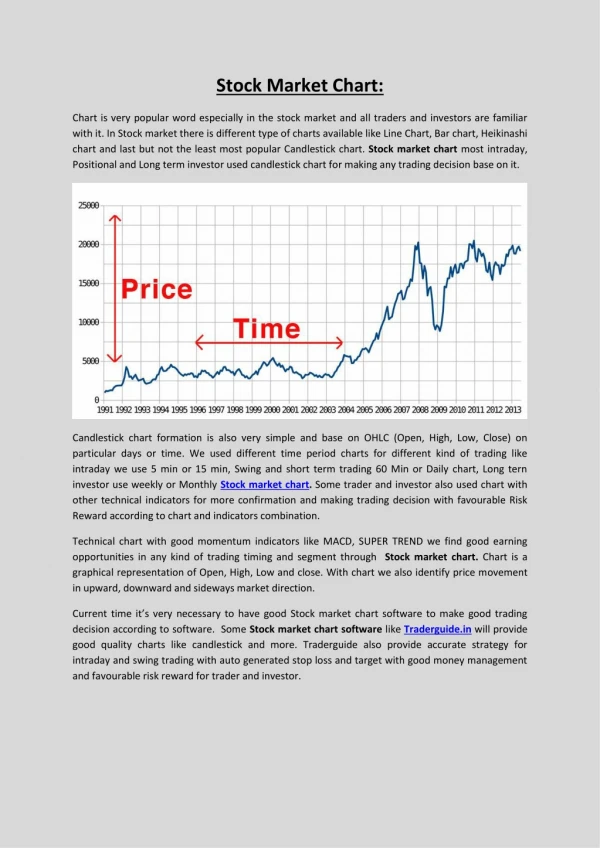
A candlestick chart is a type of financial chart used to display the price movements of a security, derivative, or currency. Each candlestick on the chart represents the price range for a specific time, such as one day or one week. The body of the candlestick represents the price range between the open and closed prices for the period. The wick or shadow shows the high and low prices for the period.
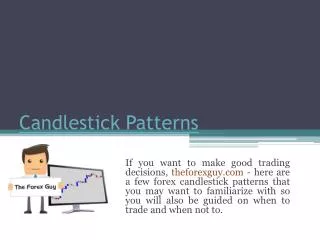
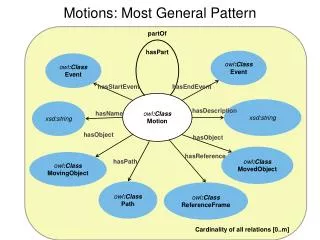
Candlestick patterns are formed by the arrangement of candlesticks on a chart and can provide insight into the underlying price action and market sentiment. Some common candlestick patterns include the Doji, hammer, shooting star, and engulfing pattern.
The Doji is a candlestick pattern that is formed when the open and close prices are nearly equal, resulting in a small body with long wicks on either side. This pattern indicates indecision or a lack of direction in the market and can be a sign of a potential trend reversal.
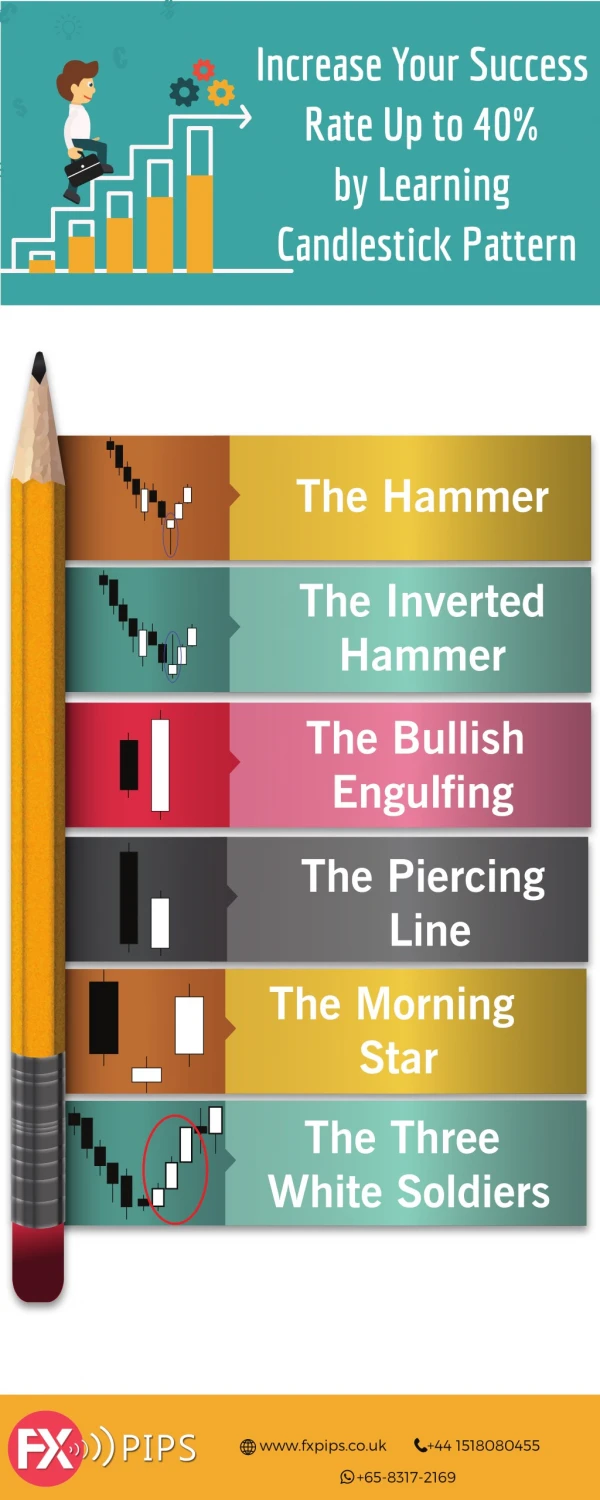
The Hammer is a bullish candlestick pattern that is formed when the open, high, and close prices are all near the lowest price for the period. The long lower wick indicates that the price was pushed down during the period, but ultimately closed near the high, suggesting buying pressure.
The shooting star is a bearish candlestick pattern that is formed when the open, low, and close prices are all near the high price for the period. The long upper wick indicates that the price was pushed up during the period, but ultimately closed near the low, suggesting selling pressure.
The engulfing pattern is a two-candlestick pattern in which the body of the second candlestick completely engulfs the body of the first candlestick. If the second candlestick is bullish, it indicates a potential trend reversal from negative to positive. If the second candlestick is bearish, it indicates a potential trend reversal from bullish to bearish.
Candlestick patterns can be a useful tool for technical analysis. However, it is critical to note that they should not be relied upon in isolation and should be used in conjunction with other forms of analysis.
About Us! Trade with Market curriculum and teaching approach develops students’ inventiveness, fortitude, and practical abilities to improve their chances of landing a job or making money on the financial markets. The academic program at the college is designed to maximize the effectiveness of its courses and enhance the student experience by utilizing the diverse student community.
Find & Contact Us on Detail! support@tradewithmarket.com SCO 21-22, Sector 19C, Chandigarh, 160019 https://tradewithmarket.com/