1 / 61

100

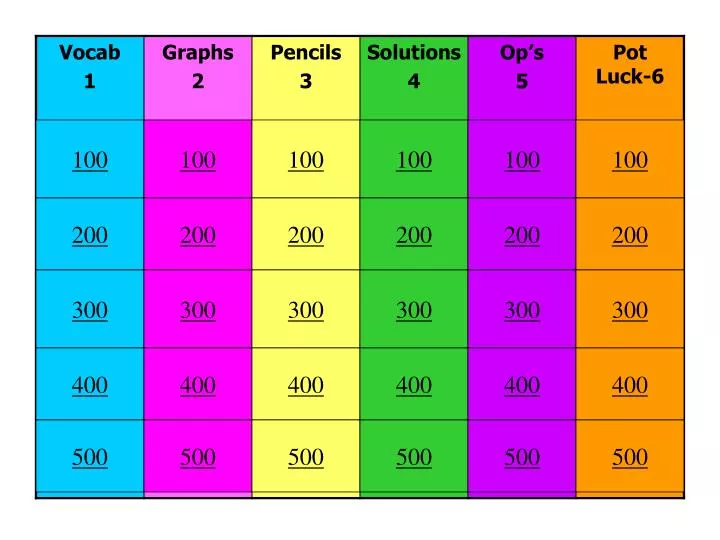
100. 100. 100. 100. 100. 100. 200. 200. 200. 200. 200. 200. 300. 300. 300. 300. 300. 300. 400. 400. 400. 400. 400. 400. 500. 500. 500. 500. 500. 500. Another word for the “mean” (100). Average. The middle number in a set of ordered data (200). Median.

Download Presentation

100

An Image/Link below is provided (as is) to download presentation Download Policy: Content on the Website is provided to you AS IS for your information and personal use and may not be sold / licensed / shared on other websites without getting consent from its author. Content is provided to you AS IS for your information and personal use only. Download presentation by click this link. While downloading, if for some reason you are not able to download a presentation, the publisher may have deleted the file from their server. During download, if you can't get a presentation, the file might be deleted by the publisher.

E N D

Presentation Transcript


  1. 100 100 100 100 100 100 200 200 200 200 200 200 300 300 300 300 300 300 400 400 400 400 400 400 500 500 500 500 500 500

  2. Another word for the “mean” (100)

  3. Average

  4. The middle number in a set of ordered data (200)

  5. Median

  6. The data value which appears the most often (300)

  7. Mode

  8. Same as the “average” in statistics - It is found by adding the data and dividing by the number of data items.(400)

  9. Mean

  10. Difference between the greatest and the least values in a set of numerical data (500)

  11. Range

  12. Information used to create graphs and find statistics(100)

  13. Data

  14. Type of graph most appropriate to compare amounts (200)

  15. Bar graph

  16. Most appropriate graph to compare parts to a whole. Each wedge represents a part of the whole (300)

  17. Circle graph

  18. Graph which best shows amount of changes over time(400)

  19. Line graph

  20. Shows the number of times each answer occurs(500)

  21. Frequency table

  22. 85 In this set of data -- 85,80,60,85,70(100)

  23. Mode

  24. 16 In this set of data -- 10,6,14,20,22(200)

  25. Range

  26. 12 In this set of data-- 13,6,10,12,13(300)

  27. Median

  28. 81 In this set of data-- 70,80,82,85 (400)

  29. Median

  30. 75 In this set of data-- 70,60,80,82(500)

  31. Median

  32. 30 In this set of data-- 80,86,70,100(100)

  33. Range

  34. 50 In this set of data-- 50,42,50,32,50,60(200)

  35. Mode

  36. 20 In this set of data-- 25,25,30,10,10 (300)

  37. Mean or average

  38. 25 In this set of data-- 40,10,30,20(400 )

  39. Mean or average

  40. 80 In this set of data-- 20,40,60,80,100,100 (500)

  41. Range

  42. Answer to a subtraction (100)

  43. Difference

  44. Answer to a multiplication problem(200)

  45. Product

  46. Answer to a division problem(300)

  47. Quotient

  48. 42 in the equation 42÷6=7 (400)

  49. Dividend

  50. 6 in the equation 42÷ 6 =7(500)

More Related