Download
1 / 37
380 likes | 547 Views
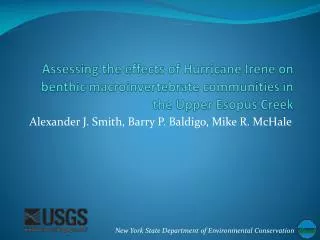
Inter-site and inter-specific differences in rates of survival and growth of C. ariakensis and C. virginica : A collaborative on-bottom study in Virginia and Maryland. Kingsley-Smith, P. R.,

E N D
Inter-site and inter-specific differences in rates of survival and growth of C. ariakensis and C. virginica: A collaborative on-bottom study in Virginia and Maryland Kingsley-Smith, P. R., Harwell, H. D, Kellogg, M. L., Allen, S. K. Jr., Meritt, D. W., Paynter, K. T. Jr. & Luckenbach, M. W. 9th International Conference on Shellfish Restoration Charleston, South Carolina, USA November 15th-19th 2006
COLLABORATORS University of Maryland Center for Environmental Science (UMCES) Horn Point Laboratory FUNDING SOURCES
I. INTRODUCTION • Current knowledge of C. ariakensis survival and growth rates is based upon 1) field trials using triploids in off-bottom, caged aquaculture, and 2) quarantined studies using diploids. • Predicting rates of survival and growth of C. ariakensis in natural bottom habitats is critical to a pending decision on an intentional introduction. • Accurate determination of these rates will improve parameterization of a developing demographic model. • This study is the first to grow C. virginica and C. ariakensis(in VA and MD)side-by-side on the bottom in an effort to gather survival and growth data in a more naturalistic setting.
II. METHODS Triploid C. ariakensis and C. virginica wereset on shell in May 2005 andplanted at ~400 oysters m-2 in late Oct–Nov 2005 at 4 sites in VA and MD.
II. METHODS Oysters were planted in 2’ x 2’ bread trays in 5 x 5 arrays in late Oct-Nov 2005.
II. METHODS Machipongo River Virginia Cages were placed around the trays to prevent disturbances by large epibenthic predators (e.g., cownose rays) and humans, while allowing access to small predators (e.g., xanthid crabs).
II. METHODS • Treatments (single treatment per cage): • C. virginica only • C. ariakensis only • C. virginica and C. ariakensis in a 50 : 50 mix • Shell only (no live oysters) • Experimental design: • 2 replicate cages (blocks 1 and 2) per treatment (4) at each field site. • 4 sites (2 sites in Virginia; 2 sites in Maryland). • Sites were chosen to cover a range of salinities, water depths, disease pressures and relative predator abundances.
II. METHODS Delaware Bay Severn River Patuxent River Chesapeake Bay Machipongo River Atlantic Ocean York River 25 km
II. METHODS MACHIPONGO RIVER, VA Intertidal Salinity: ~30 psu Predation pressure: High High Dermo & High MSX
II. METHODS YORK RIVER, VA Subtidal (1-2m) Salinity: 20-25 psu Predation pressure: High High Dermo & High MSX
II. METHODS PATUXENT RIVER, MD Subtidal (3-4m) Salinity: 8-10 psu Predation pressure: Moderate Low Dermo & No MSX Courtesy of Paynter Lab SEVERN RIVER, MD Subtidal (3-4m) Salinity: 5-8 psu Predation pressure: Low No Dermo & No MSX Courtesy of Paynter Lab
II. METHODS • Sampling = removal of 3 trays from each cage and replacement of sampled trays with those containing only clean shell. • Cages were sampled one month after deployment (i.e., Nov-Dec 2005) to assess handling and early post-deployment mortality. • Quarterly sampling thereafter: • Apr 2006, July 2006 and Oct 2006. • Future sampling: • Apr 2007, July 2007 and Oct 2007.
II. METHODS • This study will provide data on the following parameters: • oyster survival (# live oysters) • oyster growth (shell height mm) • oyster biomass (ash-free dry weight) • ploidy/reversion (biosecurity) • disease (RFTM & histology) • gametogenesis (histology) • comparisons of habitat complexity between treatments (spp.) and its relationship to associated free-living and attached faunal assemblages. • (Poster by Heather Harwell et al.).
II. METHODS • This study will provide data on the following parameters: • oyster survival (# live oysters) • oyster growth (shell height mm) • oyster biomass (ash-free dry weight) • ploidy/reversion (biosecurity) • disease (RFTM & histology) • gametogenesis (histology) • comparisons of habitat complexity between treatments (spp.) and its relationship to associated free-living and attached faunal assemblages. • (Poster by Heather Harwell et al.). July 2006
III. RESULTS – SURVIVAL 140 140 140 140 120 120 120 120 100 100 100 100 80 80 80 80 60 60 60 60 40 40 40 40 20 20 20 20 0 0 0 0 Oct Oct Oct Oct Dec Dec Dec Dec Jan Jan Jan Jan Feb Feb Feb Feb Mar Mar Mar Mar Apr Apr Apr Apr May May May May Jun Jun Jun Jun Jul Jul Jul Jul Nov Nov Nov Nov Single spp. cages only Error bars are S.D.s (n = 6) MACHIPONGO RIVER YORK RIVER C. virginica C. ariakensis 2005 2006 2005 2006 Mean no. oyster tray -1 PATUXENT RIVER SEVERN RIVER 2005 2006 2005 2006
III. RESULTS – SURVIVAL - Within site comparisons Error bars are S.E.s 100 C. virginica C. ariakensis 80 60 Mean # live oysters per tray 40 20 0 1 2 1 2 1 2 1 2 Machipongo York Patuxent Severn
III. RESULTS – SURVIVAL - Within site comparisons 100 C. virginica C. ariakensis BLOCKS & SPP. NOT SIGNIFICANTLY DIFFERENT 80 60 SIGNIFICANT BLOCK & SPP. EFFECTS Mean # live oysters per tray 40 20 0 1 2 1 2 1 2 1 2 Machipongo York Patuxent Severn
III. RESULTS – SURVIVAL - Within site comparisons Error bars are S.E.s 100 C. virginica C. ariakensis 80 60 Mean # live oysters per tray 40 20 0 1 2 combined combined combined Machipongo York Patuxent Severn
III. RESULTS – SURVIVAL - Within site comparisons Error bars are S.E.s 100 C. virginica C. ariakensis 80 60 Mean # live oysters per tray 40 ns 20 0 1 2 combined combined combined Machipongo York Patuxent Severn
III. RESULTS – SURVIVAL - Within site comparisons Error bars are S.E.s Subtidal 100 C. virginica C. ariakensis 80 Intertidal 60 Mean # live oysters per tray 40 ns 20 0 1 2 combined combined combined Machipongo York Patuxent Severn
III. RESULTS – SURVIVAL - Within site comparisons Error bars are S.E.s Subtidal 100 C. virginica C. ariakensis 80 Intertidal MLW 60 Mean # live oysters per tray MLW + 1ft 40 ns 20 0 1 2 combined combined combined Machipongo York Patuxent Severn
Machipongo River Virginia BLOCK 1
Machipongo River Virginia BLOCK 2
III. RESULTS – SURVIVAL - Within site comparisons Error bars are S.E.s Subtidal 100 C. virginica C. ariakensis 80 Intertidal MLW 60 (p = 0.06) Mean # live oysters per tray MSX? predation? MLW + 1ft 40 ns 20 0 1 2 combined combined combined Machipongo York Patuxent Severn
III. RESULTS – SURVIVAL – Across site comparisons Error bars are S.E.s 100 C. virginica C. ariakensis 80 60 Mean # live oysters per tray 40 20 0 combined combined combined combined Machipongo York Patuxent Severn
III. RESULTS – SURVIVAL – Across site comparisons Error bars are S.E.s 100 C. virginica across site comparisons 80 60 Mean # live oysters per tray 40 AB BC C A 20 0 combined combined combined combined Machipongo York Patuxent Severn
III. RESULTS – SURVIVAL – Across site comparisons Error bars are S.E.s 100 C. virginica across site comparisons 80 60 Mean # live oysters per tray 40 AB BC C A 20 0 combined combined combined combined Machipongo York Patuxent Severn
III. RESULTS – SURVIVAL – Across site comparisons Error bars are S.E.s 100 C. virginica across site comparisons 80 60 Mean # live oysters per tray 40 AB BC C A 20 0 combined combined combined combined Machipongo York Patuxent Severn
III. RESULTS – SURVIVAL – Across site comparisons Error bars are S.E.s 100 increasing survival C. virginica across site comparisons 80 60 decreasing salinity Mean # live oysters per tray 40 AB BC C A 20 0 combined combined combined combined Machipongo York Patuxent Severn
III. RESULTS – SURVIVAL – Across site comparisons Error bars are S.E.s 100 C. virginica across site comparisons 80 Machipongo represents suitable habitat for C. virginica (survival comparable with York River)…. 60 Mean # live oysters per tray 40 AB BC C A 20 0 combined combined combined combined Machipongo York Patuxent Severn
III. RESULTS – SURVIVAL – Across site comparisons Error bars are S.E.s 100 C. ariakensis across site comparisons 80 …but less suitable habitat for C. ariakensis 60 Mean # live oysters per tray 40 b b b 20 a 0 combined combined combined combined Machipongo York Patuxent Severn
III. RESULTS – GROWTH MACHIPONGO RIVER, VA JULY 5TH 2006 YORK RIVER, VA JULY 24TH 2006 C. virginica C. ariakensis # oysters PATUXENT RIVER, MD JULY 10TH 2006 SEVERN RIVER, MD JULY 17TH 2006 Shell height (mm) (Data include oysters from both single and mixed spp. cages.)
IV. CONCLUSIONS • Survival and growth data are now available for triploid C. ariakensis and C. virginica from several bottom habitats ranging in salinity, depth, disease pressure and relative predator abundance. • Significant interactions were observed between sites and species for both survival and growth. • Lowest survival of both species was observed at the intertidal Machipongo River site, with C. ariakensis survival especially low. • Highest growth rates of C. ariakensis were observed at the York River (site characteristics: subtidal & high salinity). • Both species (particularly C. virginica) show a trend of increased survival with decreasing salinity across sites. • Growth rates of C. virginica and C. ariakensis were most similar at the low salinity Severn River site.
V. ACKNOWLEDGEMENTS University of Maryland (sampling help) Jake Goodwin Mark Sherman Steve Allen Marcy Chen Nancy Ward Eastern Shore Lab Reade Bonniwell PG Ross Sean Fate Alan Birch Edward Smith Jamie Wheatley Al Curry Stephanie Bonniwell Rochelle Brown VIMS ABC Shane Bonnot Ryan Gill Karen Hudson VIMS Shellfish Pathology Lab Ryan Carnegie Rita Crockett Susan Denny ESL Summer aides Raija Bushnell Sarah Mallette Matt Foley Andrew Wilson Andrew Matkin
Pre-deployment shell height distributions 10 C. ariakensis (mean SH = 13.85mm, n = 1272) C. virginica (mean SH = 12.80mm, n = 1362) 8 6 % frequency 4 2 5 10 15 20 25 30 35 40 shell height (mm)