Download
1 / 87
870 likes | 1.05k Views
TAU Performance System. Workshop on Petascale Architectures and Performance Strategies 4-5pm, Tuesday, July 24, 2007, Snowbird, UT Sameer S. Shende sameer@cs.uoregon.edu http://www.cs.uoregon.edu/research/tau Performance Research Laboratory University of Oregon. Acknowledgements.

E N D
TAU Performance System Workshop on Petascale Architectures and Performance Strategies 4-5pm, Tuesday, July 24, 2007, Snowbird, UT Sameer S. Shende sameer@cs.uoregon.edu http://www.cs.uoregon.edu/research/tau Performance Research Laboratory University of Oregon
Acknowledgements • Dr. Allen D. Malony, Professor • Alan Morris, Senior software engineer • Wyatt Spear, Software engineer • Scott Biersdorff, Software engineer • Kevin Huck, Ph.D. student • Aroon Nataraj, Ph.D. student • Brad Davidson, Systems administrator
Performance Evaluation • Profiling • Presents summary statistics of performance metrics • number of times a routine was invoked • exclusive, inclusive time/hpm counts spent executing it • number of instrumented child routines invoked, etc. • structure of invocations (calltrees/callgraphs) • memory, message communication sizes also tracked • Tracing • Presents when and where events took place along a global timeline • timestamped log of events • message communication events (sends/receives) are tracked • shows when and where messages were sent • large volume of performance data generated leads to more perturbation in the program
Definitions – Profiling • Profiling • Recording of summary information during execution • inclusive, exclusive time, # calls, hardware statistics, … • Reflects performance behavior of program entities • functions, loops, basic blocks • user-defined “semantic” entities • Very good for low-cost performance assessment • Helps to expose performance bottlenecks and hotspots • Implemented through • sampling: periodic OS interrupts or hardware counter traps • instrumentation: direct insertion of measurement code
Definitions – Tracing • Tracing • Recording of information about significant points (events) during program execution • entering/exiting code region (function, loop, block, …) • thread/process interactions (e.g., send/receive message) • Save information in event record • timestamp • CPU identifier, thread identifier • Event type and event-specific information • Event trace is a time-sequenced stream of event records • Can be used to reconstruct dynamic program behavior • Typically requires code instrumentation
Event definition CPU A: void master { trace(ENTER, 1); ... trace(SEND, B); send(B, tag, buf); ... trace(EXIT, 1); } 1 2 3 master worker ... timestamp MONITOR 62 68 ... 58 69 ... 60 64 B A A B B A SEND EXIT ENTER RECV EXIT ENTER B 1 2 2 1 A CPU B: void worker { trace(ENTER, 2); ... recv(A, tag, buf); trace(RECV, A); ... trace(EXIT, 2); } Event Tracing: Instrumentation, Monitor, Trace
main master 1 2 3 master worker ... worker ... 69 62 64 58 60 ... 68 A A B B A B EXIT RECV SEND EXIT ENTER ENTER 1 1 2 B A 2 B A 60 62 64 68 70 58 66 Event Tracing: “Timeline” Visualization
Steps of Performance Evaluation • Collect basic routine-level timing profile to determine where most time is being spent • Collect routine-level hardware counter data to determine types of performance problems • Collect callpath profiles to determine sequence of events causing performance problems • Conduct finer-grained profiling and/or tracing to pinpoint performance bottlenecks • Loop-level profiling with hardware counters • Tracing of communication operations
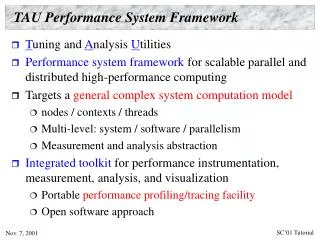
TAU Performance System • Tuning and Analysis Utilities (15+ year project effort) • Performance system framework for HPC systems • Integrated, scalable, flexible, and parallel • Targets a general complex system computation model • Entities: nodes / contexts / threads • Multi-level: system / software / parallelism • Measurement and analysis abstraction • Integrated toolkit for performance problem solving • Instrumentation, measurement, analysis, and visualization • Portable performance profiling and tracing facility • Performance data management and data mining • Partners: LLNL, ANL, LANL, Research Center Jülich
TAU Parallel Performance System Goals • Portable (open source) parallel performance system • Computer system architectures and operating systems • Different programming languages and compilers • Multi-level, multi-language performance instrumentation • Flexible and configurable performance measurement • Support for multiple parallel programming paradigms • Multi-threading, message passing, mixed-mode, hybrid, object oriented (generic), component-based • Support for performance mapping • Integration of leading performance technology • Scalable (very large) parallel performance analysis
Program Database Toolkit (PDT) Application / Library C / C++ parser Fortran parser F77/90/95 Program documentation PDBhtml Application component glue IL IL SILOON C / C++ IL analyzer Fortran IL analyzer C++ / F90/95 interoperability CHASM Program Database Files Automatic source instrumentation TAU_instr DUCTAPE
TAU Instrumentation Approach • Support for standard program events • Routines, classes and templates • Statement-level blocks • Support for user-defined events • Begin/End events (“user-defined timers”) • Atomic events (e.g., size of memory allocated/freed) • Selection of event statistics • Support for hardware performance counters (PAPI) • Support definition of “semantic” entities for mapping • Support for event groups (aggregation, selection) • Instrumentation optimization • Eliminate instrumentation in lightweight routines
PAPI • Performance Application Programming Interface • The purpose of the PAPI project is to design, standardize and implement a portable and efficient API to access the hardware performance monitor counters found on most modern microprocessors. • Parallel Tools Consortium project started in 1998 • Developed by University of Tennessee, Knoxville • http://icl.cs.utk.edu/papi/
TAU Instrumentation Mechanisms • Source code • Manual (TAU API, TAU component API) • Automatic (robust) • C, C++, F77/90/95 (Program Database Toolkit (PDT)) • OpenMP (directive rewriting (Opari), POMP2 spec) • Object code • Pre-instrumented libraries (e.g., MPI using PMPI) • Statically-linked and dynamically-linked • Executable code • Dynamic instrumentation (pre-execution) (DynInstAPI) • Virtual machine instrumentation (e.g., Java using JVMPI) • TAU_COMPILER to automate instrumentation process
Using TAU: A brief Introduction • To instrument source code using PDT • Choose an appropriate TAU stub makefile in <arch>/lib: % setenv TAU_MAKEFILE /usr/tau-2.x/xt3/lib/Makefile.tau-mpi-pdt-pgi % setenv TAU_OPTIONS ‘-optVerbose …’ (see tau_compiler.sh) And use tau_f90.sh, tau_cxx.sh or tau_cc.sh as Fortran, C++ or C compilers: % mpif90 foo.f90 changes to % tau_f90.sh foo.f90 • Execute application and analyze performance data: % pprof (for text based profile display) % paraprof (for GUI)
TAU Measurement System Configuration • configure [OPTIONS] {-c++=<CC>, -cc=<cc>}Specify C++ and C compilers -pdt=<dir> Specify location of PDT -opari=<dir> Specify location of Opari OpenMP tool -papi=<dir> Specify location of PAPI -vampirtrace=<dir> Specify location of VampirTrace -mpi[inc/lib]=<dir> Specify MPI library instrumentation -dyninst=<dir> Specify location of DynInst Package -shmem[inc/lib]=<dir> Specify PSHMEM library instrumentation -python[inc/lib]=<dir> Specify Python instrumentation -tag=<name> Specify a unique configuration name -epilog=<dir> Specify location of EPILOG -slog2 Build SLOG2/Jumpshot tracing package -otf=<dir> Specify location of OTF trace package -arch=<architecture> Specify architecture explicitly (bgl, xt3,ibm64,ibm64linux…) {-pthread, -sproc} Use pthread or SGI sproc threads -openmp Use OpenMP threads -jdk=<dir> Specify Java instrumentation (JDK) -fortran=[vendor] Specify Fortran compiler
TAU Measurement System Configuration • configure [OPTIONS] -TRACE Generate binary TAU traces -PROFILE (default) Generate profiles (summary) -PROFILECALLPATH Generate call path profiles -PROFILEPHASE Generate phase based profiles -PROFILEPARAM Generate parameter based profiles -PROFILEMEMORY Track heap memory for each routine -PROFILEHEADROOM Track memory headroom to grow -MULTIPLECOUNTERS Use hardware counters + time -COMPENSATE Compensate timer overhead -CPUTIME Use usertime+system time -PAPIWALLCLOCK Use PAPI’s wallclock time -PAPIVIRTUAL Use PAPI’s process virtual time -SGITIMERS Use fast IRIX timers -LINUXTIMERS Use fast x86 Linux timers
Performance Evaluation Alternatives Depthlimit profile Callpath/callgraph profile Parameter profile Trace Phase profile Flat profile • Each alternative has: • one metric/counter • multiple counters Volume of performance data
TAU Measurement Configuration – Examples • ./configure –pdt=/usr/pkgs/pkgs/pdtoolkit-3.11 -mpiinc=/usr/pkgs/mpich/include -mpilib=/usr/pkgs/mpich/lib -mpilibrary=‘-lmpich -L/usr/gm/lib64 -lgm -lpthread -ldl’ • Configure using PDT and MPI for x86_64 Linux • ./configure -arch=xt3 -papi=/opt/xt-tools/papi/3.2.1 -mpi -MULTIPLECOUNTERS; make clean install • Use PAPI counters (one or more) with C/C++/F90 automatic instrumentation for XT3. Also instrument the MPI library. Use PGI compilers. • Typically configure multiple measurement libraries • Each configuration creates a unique <arch>/lib/Makefile.tau<options> stub makefile. It corresponds to the configuration options used. e.g., • /usr/pkgs/tau/x86_64/lib/Makefile.tau-mpi-pdt-pgi • /usr/pkgs/tau/x86_64/lib/Makefile.tau-multiplecounters-mpi-papi-pdt-pgi
TAU Measurement Configuration – Examples % cd /usr/pkgs/tau/x86_64/lib; ls Makefile.*pgi Makefile.tau-pdt-pgi Makefile.tau-mpi-pdt-pgi Makefile.tau-callpath-mpi-pdt-pgi Makefile.tau-mpi-pdt-trace-pgi Makefile.tau-mpi-compensate-pdt-pgi Makefile.tau-multiplecounters-mpi-papi-pdt-pgi Makefile.tau-multiplecounters-mpi-papi-pdt-trace-pgi Makefile.tau-mpi-papi-pdt-epilog-trace-pgi Makefile.tau-pdt-pgi… • For an MPI+F90 application, you may want to start with: Makefile.tau-mpi-pdt-pgi • Supports MPI instrumentation & PDT for automatic source instrumentation for PGI compilers
Configuration Parameters in Stub Makefiles • Each TAU stub Makefile resides in <tau>/<arch>/lib directory • Variables: • TAU_CXX Specify the C++ compiler used by TAU • TAU_CC, TAU_F90 Specify the C, F90 compilers • TAU_DEFS Defines used by TAU. Add to CFLAGS • TAU_LDFLAGS Linker options. Add to LDFLAGS • TAU_INCLUDE Header files include path. Add to CFLAGS • TAU_LIBS Statically linked TAU library. Add to LIBS • TAU_SHLIBS Dynamically linked TAU library • TAU_MPI_LIBS TAU’s MPI wrapper library for C/C++ • TAU_MPI_FLIBS TAU’s MPI wrapper library for F90 • TAU_FORTRANLIBS Must be linked in with C++ linker for F90 • TAU_CXXLIBS Must be linked in with F90 linker • TAU_INCLUDE_MEMORY Use TAU’s malloc/free wrapper lib • TAU_DISABLE TAU’s dummy F90 stub library • TAU_COMPILER Instrument using tau_compiler.sh script • Each stub makefile encapsulates the parameters that TAU was configured with • It represents a specific instance of the TAU libraries. TAU scripts use stub makefiles to identify what performance measurements are to be performed.
Automatic Instrumentation • We now provide compiler wrapper scripts • Simply replace mpxlf90 with tau_f90.sh • Automatically instruments Fortran source code, links with TAU MPI Wrapper libraries. • Use tau_cc.sh and tau_cxx.sh for C/C++ Before CXX = mpCC F90 = mpxlf90_r CFLAGS = LIBS =-lm OBJS = f1.o f2.o f3.o … fn.o app: $(OBJS) $(CXX) $(LDFLAGS) $(OBJS) -o $@ $(LIBS) .cpp.o: $(CC) $(CFLAGS) -c $< After CXX = tau_cxx.sh F90 = tau_f90.sh CFLAGS = LIBS =-lm OBJS = f1.o f2.o f3.o … fn.o app: $(OBJS) $(CXX) $(LDFLAGS) $(OBJS) -o $@ $(LIBS) .cpp.o: $(CC) $(CFLAGS) -c $<
TAU_COMPILER Commandline Options • See <taudir>/<arch>/bin/tau_compiler.sh –help • Compilation: % mpxlf90 -c foo.f90 Changes to% f95parse foo.f90 $(OPT1)% tau_instrumentor foo.pdb foo.f90 –o foo.inst.f90 $(OPT2)% mpxlf90 –c foo.f90 $(OPT3) • Linking: % mpxlf90 foo.o bar.o –o app Changes to% mpxlf90 foo.o bar.o –o app $(OPT4) • Where options OPT[1-4] default values may be overridden by the user: F90 = $(TAU_COMPILER) $(MYOPTIONS) mpxlf90
TAU_COMPILER Options • Optional parameters for $(TAU_COMPILER): [tau_compiler.sh –help] -optVerbose Turn on verbose debugging messages -optDetectMemoryLeaks Turn on debugging memory allocations/ de-allocations to track leaks -optPdtGnuFortranParser Use gfparse (GNU) instead of f95parse (Cleanscape) for parsing Fortran source code -optKeepFiles Does not remove intermediate .pdb and .inst.* files -optPreProcess Preprocess Fortran sources before instrumentation -optTauSelectFile="" Specify selective instrumentation file for tau_instrumentor -optLinking="" Options passed to the linker. Typically $(TAU_MPI_FLIBS) $(TAU_LIBS) $(TAU_CXXLIBS) -optCompile="" Options passed to the compiler. Typically $(TAU_MPI_INCLUDE) $(TAU_INCLUDE) $(TAU_DEFS) -optPdtF95Opts="" Add options for Fortran parser in PDT (f95parse/gfparse) -optPdtF95Reset="" Reset options for Fortran parser in PDT (f95parse/gfparse) -optPdtCOpts="" Options for C parser in PDT (cparse). Typically $(TAU_MPI_INCLUDE) $(TAU_INCLUDE) $(TAU_DEFS) -optPdtCxxOpts="" Options for C++ parser in PDT (cxxparse). Typically$(TAU_MPI_INCLUDE) $(TAU_INCLUDE) $(TAU_DEFS) ...
Overriding Default Options:TAU_COMPILER % cat Makefile F90 = tau_f90.sh OBJS = f1.o f2.o f3.o … LIBS = -Lappdir –lapplib1 –lapplib2 … app: $(OBJS) $(F90) $(OBJS) –o app $(LIBS) .f90.o: $(F90) –c $< % setenv TAU_OPTIONS ‘-optVerbose -optTauSelectFile=select.tau -optKeepFiles’ % setenv TAU_MAKEFILE <taudir>/x86_64/lib/Makefile.tau-mpi-pdt
Optimization of Program Instrumentation • Need to eliminate instrumentation in frequently executing lightweight routines • Throttling of events at runtime: % setenv TAU_THROTTLE 1 Turns off instrumentation in routines that execute over 100000 times (TAU_THROTTLE_NUMCALLS) and take less than 10 microseconds of inclusive time per call (TAU_THROTTLE_PERCALL) • Selective instrumentation file to filter events % tau_instrumentor [options] –f <file> OR % setenv TAU_OPTIONS ’-optTauSelectFile=tau.txt’ • Compensation of local instrumentation overhead % configure -COMPENSATE
Selective Instrumentation File • Specify a list of routines to exclude or include (case sensitive) • # is a wildcard in a routine name. It cannot appear in the first column. BEGIN_EXCLUDE_LIST Foo Bar D#EMM END_EXCLUDE_LIST • Specify a list of routines to include for instrumentation BEGIN_INCLUDE_LIST int main(int, char **) F1 F3 END_EXCLUDE_LIST • Specify either an include list or an exclude list!
Selective Instrumentation File • Optionally specify a list of files to exclude or include (case sensitive) • * and ? may be used as wildcard characters in a file name BEGIN_FILE_EXCLUDE_LIST f*.f90 Foo?.cpp END_FILE_EXCLUDE_LIST • Specify a list of routines to include for instrumentation BEGIN_FILE_INCLUDE_LIST main.cpp foo.f90 END_FILE_INCLUDE_LIST
Selective Instrumentation File • User instrumentation commands are placed in INSTRUMENT section • ? and * used as wildcard characters for file name, # for routine name • \ as escape character for quotes • Routine entry/exit, arbitrary code insertion • Outer-loop level instrumentation BEGIN_INSTRUMENT_SECTION loops file=“foo.f90” routine=“matrix#” memory file=“foo.f90” routine=“#” io routine=“MATRIX” file=“foo.f90” line = 123 code = " print *, \" In foo\"" exit routine = “int f1()” code = "cout <<\“Out f1\"<<endl;" END_INSTRUMENT_SECTION
Manual Instrumentation – C/C++ Example #include <TAU.h> int main(int argc, char **argv) { TAU_START (“big-loop”) for(int i = 0; i < N ; i++){ work(i); } TAU_STOP (“big-loop”); } % g++ foo.cpp –I<taudir>/include –c % g++ foo.o –o foo –L<taudir>/<arch>/lib –lTAU
Jumpshot • http://www-unix.mcs.anl.gov/perfvis/software/viewers/index.htm • Developed at Argonne National Laboratory as part of the MPICH project • Rusty Lusk, PI • Also works with other MPI implementations • Jumpshot is bundled with the TAU package • Java-based tracefile visualization tool for postmortem performance analysis of MPI programs • Latest version is Jumpshot-4 for SLOG-2 format • Scalable level of detail support • Timeline and histogram views • Scrolling and zooming • Search/scan facility
Tracing: Using TAU and Jumpshot • Configure TAU with -TRACE option: % configure –TRACE –otf=<dir> -MULTIPLECOUNTERS –papi=<dir> -mpi –pdt=dir … • Set environment variables: % setenv TRACEDIR /p/gm1/<login>/traces % setenv COUNTER1 GET_TIME_OF_DAY (reqd) % setenv COUNTER2 PAPI_FP_INS % setenv COUNTER3 PAPI_TOT_CYC … • Execute application and analyze the traces: % mpirun -np 32 ./a.out [args] % tau_treemerge.pl % tau2slog2 tau.trc tau.edf –o app.slog2 % jumpshot app.slog2
User-level abstractions problem domain linker OS Multi-Level Instrumentation and Mapping • Multiple interfaces • Information sharing • Between interfaces • Event selection • Within/between levels • Mapping • Associate performance data with high-level semantic abstractions source code instrumentation preprocessor instrumentation source code instrumentation compiler instrumentation object code libraries executable instrumentation instrumentation runtime image instrumentation instrumentation VM performancedata run
TAU Measurement Approach • Portable and scalable parallel profiling solution • Multiple profiling types and options • Event selection and control (enabling/disabling, throttling) • Online profile access and sampling • Online performance profile overhead compensation • Portable and scalable parallel tracing solution • Trace translation to SLOG2, OTF, EPILOG, and Paraver • Trace streams (OTF) and hierarchical trace merging • Robust timing and hardware performance support • Multiple counters (hardware, user-defined, system) • Performance measurement for CCA component software
TAU Measurement Mechanisms • Parallel profiling • Function-level, block-level, statement-level • Supports user-defined events and mapping events • TAU parallel profile stored (dumped) during execution • Support for flat, callgraph/callpath, phase profiling • Support for memory profiling (headroom, malloc/leaks) • Support for tracking I/O (wrappers, Fortran instrumentation of read/write/print calls) • Tracing • All profile-level events • Inter-process communication events • Inclusion of multiple counter data in traced events
Types of Parallel Performance Profiling • Flatprofiles • Metric (e.g., time) spent in an event (callgraph nodes) • Exclusive/inclusive, # of calls, child calls • Callpath profiles (Calldepth profiles) • Time spent along a calling path (edges in callgraph) • “main=> f1 => f2 => MPI_Send” (event name) • TAU_CALLPATH_DEPTH environment variable • Phase profiles • Flat profiles under a phase (nested phases are allowed) • Default “main” phase • Supports static or dynamic (per-iteration) phases
Performance Analysis and Visualization • Analysis of parallel profile and trace measurement • Parallel profile analysis • ParaProf: parallel profile analysis and presentation • ParaVis: parallel performance visualization package • Profile generation from trace data (tau2profile) • Performance data management framework (PerfDMF) • Parallel trace analysis • Translation to VTF (V3.0), EPILOG, OTF formats • Integration with VNG (Technical University of Dresden) • Online parallel analysis and visualization • Integration with CUBE browser (KOJAK, UTK, FZJ)
ParaProf Parallel Performance Profile Analysis Raw files HPMToolkit PerfDMFmanaged (database) Metadata MpiP Application Experiment Trial TAU
ParaProf – Flat Profile (Miranda, BG/L) node, context, thread 8K processors Miranda hydrodynamics Fortran + MPI LLNL Run to 64K
Terminology – Example • For routine “int main( )”: • Exclusive time • 100-20-50-20=10 secs • Inclusive time • 100 secs • Calls • 1 call • Subrs (no. of child routines called) • 3 • Inclusive time/call • 100secs int main( ) { /* takes 100 secs */ f1(); /* takes 20 secs */ f2(); /* takes 50 secs */ f1(); /* takes 20 secs */ /* other work */ } /* Time can be replaced by counts from PAPI e.g., PAPI_FP_OPS. */
ParaProf – Callpath Profile (Flash) Flash thermonuclear flashes Fortran + MPI Argonne
Comparing Effects of MultiCore Processors • AORSA2D on 4k cores • PAPI resource stalls • Blue is single node • Red is dual core
Comparing FLOPS: MultiCore Processors • AORSA2D on 4k cores • Floating pt ins/second • Blue is dual core • Red is single node
ParaProf – Scalable Histogram View (Miranda) 8k processors 16k processors
ParaProf – 3D Full Profile (Miranda) 16k processors