Download
1 / 46
520 likes | 1.19k Views
PRECIPITATION. Introduction Forms of precipitation Types of precipitation Measurement Simons gauge & Syphon gauge Selection of rain gauge station Methods of computing average rain fall Interpolation of missing data Double mass curve Hyetograph. Introduction:.

E N D
Introduction • Forms of precipitation • Types of precipitation • Measurement Simons gauge & Syphon gauge • Selection of rain gauge station • Methods of computing average rain fall • Interpolation of missing data • Double mass curve • Hyetograph
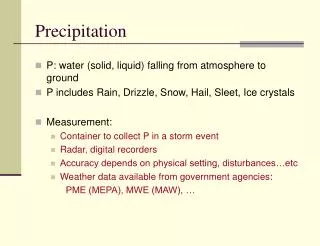
Introduction: • Precipitation is any form of solid or liquid water that falls from the atmosphere to the earth’s surface. • Rainfall, drizzle, hail and snow are examples of precipitation. In India, rain is the most common form of precipitation.
For the formation of clouds and subsequent precipitation: • Atmosphere must have moisture. • Sufficient nuclei present to aid condensation. • Weather condition must be good for condensation • Product of condensation must reach the earth.
Forms of precipitation contd….. Rain: • It is the term used to describe the precipitation in the form of water drops of sizes larger than 0.5mm. • It is the principal form of precipitation in India. • Maximum size of a rain drop is about 6mm.
Snow: • It consists of ice crystals which usually combine to form flakes. • Density varies from 0.06 to 0.15 g/cm3 . • Avg.density = 0.1 g/cm3 . • In India, snow occurs only in the Himalayan regions. Drizzle: • A fine sprinkle of numerous water droplets of size less than 0.5mm & intensity less than 1mm/h. • Drops are so small that they appear to float in air.
Glaze: When rain or drizzle comes in contact with cold ground at around 0◦C , the water drops freeze to form an ice coating called glaze or freezing rain. Sleet: • It is frozen rain drops of transparent grains which form when rain falls through air at subfreezing temperature. • In Britain, Sleet denotes precipitation of snow and rain simultaneously.
Hail: • It is a showery precipitation in the form of irregular pellets or lumps of ice of size more than 8mm. • It occur in violent thunderstorms in which vertical currents are very strong.
Types of precipitation: • Frontal precipitation • Convective precipitation • Orographic precipitation • Cyclonic precipitation
Frontal precipitation This is the precipitation that is caused by the expansion of air on ascent along or near a frontal surface.
Convective precipitation • Precipitation caused by the upward movement of air which is warmer than its surroundings. • This precipitation is generally showery nature with rapid changes of intensities.
Orographic precipitation • Precipitation caused by the air masses which strike the mountain barriers and rise up, causing condensation and precipitation. • The greatest amount of precipitation will fall on the windward side of the barrier and little amount of precipitation will fall on leave ward side.
Measurement of Precipitation • It is commonly used to estimate the amount of water falling over the land surface. • It is collected and measured in a Rain Gauge. • Pluviometer,Ombrometer,Hyetometer –terms used to designate a raingauge. • A raingauge consists of a cylindrical vessel assembly kept open to collect rain. • It is measured in depth units.(i.e.cm)
Important Considerations for Raingauge: • The ground must be level & the instrument must present a horizontal catch surface. • The gauge must be set as near the ground as possible to reduce wind effects. • But it must be sufficiently high to prevent splashing,flooding,etc. • The instrument must be surrounded by an open fenced area of at least 5.5m x 5.5m. • No object should be nearer to the instrument than 30m or twice the height of the obstruction.
Raingauge Classification • Non recording raingauges Symon’s rain gauge • Recording raingaugs Weighing bucket type Tipping bucket type Float type ( Syphon Type)
Non Recording Raingauge Symons Gauge:(IS 5225-1969) • Circular collecting area of dia.=127mm • Placed horizontally at an height of 305mm above the GL. • Water collected in the receiving vessel is measured by a graduated measuring glass. • Measurement are taken at 8.30 hours. • It gives depth of rain fall for the previous 24 hrs.
Recording RaingaugeSyphon type gauge (or Float type) (IS 5235-1969)
Selection of site for raingauge station: • Site should be an open place • The distance b/w the rain gauge & the nearest object should be at least twice the ht. of the object. • Rain gauge should never be situated on the side or top of a hill if a suitable site on a level ground can be found.
In hills, where it is difficult to find level space ,the site for the gauge should be chosen where it is best shielded from high winds. • A fence is so located that distance of the fence is not less than twice its height.
Adequacy of rain gauge station The optimal number of stations that should exist to have an assigned percentage of error in the estimation of mean rainfall is obtained by statistical analysis as • where N= optimal number of stations, • ε= allowable degree of error in the estimate of the mean rainfall • and Cv = coefficient of variation of the rainfall values at the existing m stations (in per cent). • If there are m stations in the catchment each recording rainfall values P1, P2,...,Pi,...Pm in a known time, the coefficient of variation Cv is calculated as:
In calculating N it is usual to take ε = 10%. It is seen that if the value of ε is small, the number of raingauge stations will be more. According to WMO recommendations, at least 10% of the total raingauges should be of self-recording type.
AVERAGE RAIN FALL • Rain gauge represent only point sample of the areal distribution of storm. • But for hydrological analysis requires rain fall over an area, such as over a catchment. • So it is required to convert point rainfall values at various stations into an average value over a catchment.
Methods of finding Avg.Rain fall • Arithmetic Mean Method Let P1, P2, P3, P3,….. Pi…….. Pn are the rain fall values in a given period in N stations within a catchment. Then mean precipitation,
2) The Theissen polygon method • This method, first proposed by Thiessen in 1911 • In this method representative area for each rain gauge is considered. (areas of influence)
These areas are found out using a method consisting of the following three steps: • 1. Joining the rain gauge station locations by straight lines to form triangles • 2. Bisecting the edges of the triangles to form the “Thiessen polygons” • 3. Calculate the area enclosed around each rain gauge station bounded by the polygon edges (and the catchment boundary, wherever appropriate) to find the area of influence corresponding to the rain gauge.
For the given example, the “weighted” average rainfall over the catchment is determined as,
3)The Isohyetal method • This is considered as one of the most accurate method • The method requires the plotting of isohyets and calculating the areas enclosed either between the isohyets or between an isohyet and the catchment boundary. • Isohyete is a contour, joining points of equal rainfall in the basin.
Area I = 40 km2 Area II = 80 km2 Area III = 70 km2 Area IV = 50 km2 Total catchment area = 240 km2 Area II : Corresponds to (10 + 15)/2 = 12.5 mm rainfall depth Area III : Corresponds to (5 + 10)/2 = 7.5 mm rainfall depth Hence, the average precipitation by the isohyetal method is calculated to be
Interpolation of missing data • The rainfall record at a certain station may become discontinued due to operational reasons. • Missing rainfall record would be approximated using the records of the three rain gauge stations closet to the affected station by the “Normal Ratio Method”.
Let P4is the precipitation at the missing location, • N1, N2, N3and N4are the normal annual precipitation of the four stations • and P1, P2and P3are the rainfalls recorded at the three stations 1, 2 and 3 respectively.
Inconsistency in rainfall record This may arise due to change in location of rain gauge, its degree of exposure to rainfall or change in instrument, etc. “Double Mass Curve”
Where Pcand P0are the corrected and original rainfalls at suspected station at any time. • Scand S0are the corrected and original slopes of the double mass-curve.
Presentation of Rain fall data • Mass Curve of rain fall • Hyetograph
Mass curve of rain fall • It is a plot of accumulated precipitation against time, plotted in chronological order. • Records of float type, weighing bucket type etc raingauges are of this form. • It gives information on duration and magnitude of a storm. • Intensity at various time intervals in a storm = slope of the curve.
It can be prepared for non-recording raingauges also if the approximate start and end of a storm are known. • Intensity at various time intervals in a storm = slope of the curve. • It can be prepared for non-recording raingauges also if the approximate start and end of a storm are known.
Hyetograph • It is a plot of rainfall intensity against time interval. • Time interval depends on the purpose (urban drainage problems – small durations, flood flow computations from large catchments~ 6h). • It can be derived from the mass curve of rainfall.
It is represented as a bar chart. • It is useful in developing design storms to predict extreme floods. • Area under a hyetograph = total precipitation received in that time period.
Depth-Area-Duration curves • Areal spread of rainfall within watershed is essential • high rainfall that may be expected over the catchment • storm event would start with a heavy downpour and may gradually reduce as time passes • Hence, the rainfall depth is not proportional to the time duration of rainfall observation. • rainfall over a small area may be more or less uniform • But for larger area its not uniform • Due to these facts, a Depth-Area-Duration (DAD) analysis is carried out