Download
1 / 16
160 likes | 503 Views
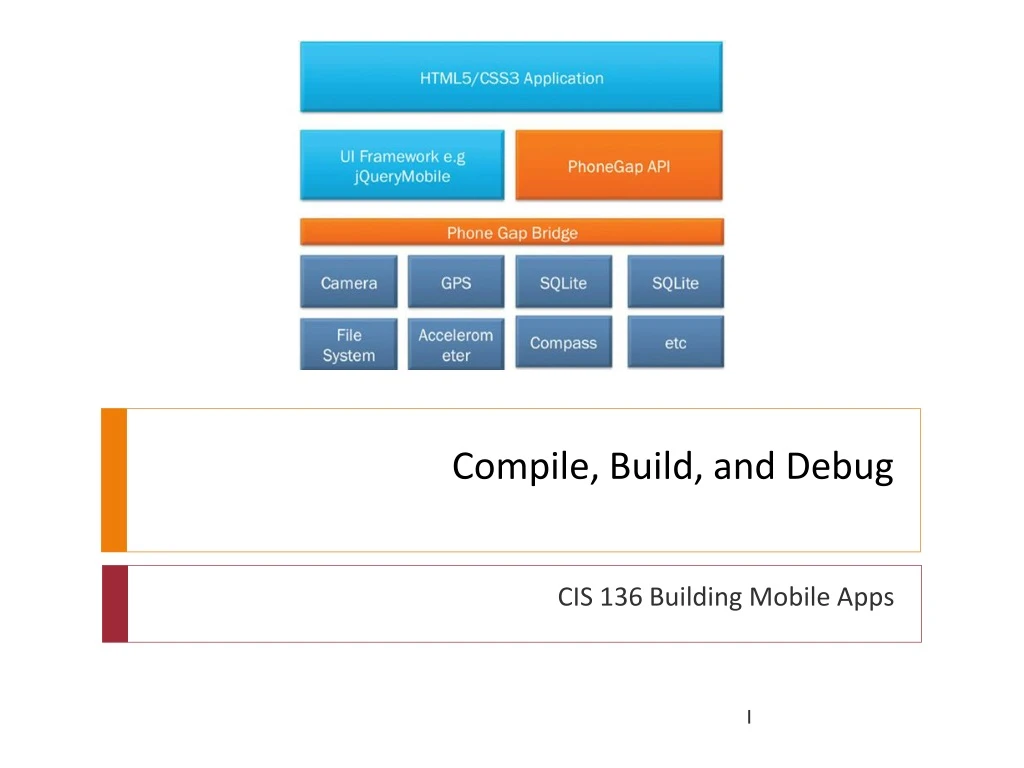
Compile, Build, and Debug. CIS 136 Building Mobile Apps. Debugging. You WILL have bugs. Debugging. To debug on the device, you must activate developer options which allow USB debugging Go to “Settings” – General, and tap on “About”.

E N D
Compile, Build, and Debug CIS 136 Building Mobile Apps
Debugging You WILL have bugs
Debugging • To debug on the device, you must activate developer options which allow USB debugging • Go to “Settings” – General, and tap on “About”. • Here, tap on “Software information” and then tap on “More”. • You will find the option of “Build number” in “More”, tap on it 7 times to activate the developer options • A new menu option will become available in the General Settings • In the Developer Setting, check the option to Allow USB Debugging
Using Chrome Inspect on Android • Hybrid apps can leverage Chrome's remote debugging features • To do so: • Connect the Android device to the PC using a USB cable • Open Chrome on your computer and in the address bar, go ahead and type in Chrome://inspect • The dev tools for devices window will open • Confirm that the discover USB devices is checked. • Your device should prompt to allow USB debugging from your computer (you might have to go to your app settings, and uncheck/recheck usbdebugging) • The device and the App should display in the Chrome://inspect window • Click inspect, and the Chrome dev tools will now open
Using Chrome Inspect • With the Inspector open, load the Index page by clicking CTRL and O • This functionality is only available when the app is compiled in in private mode (not for release) • We don't want to give away our code! • With these tools, the app can be run, logic tested, bugs resolved • Using the console its easy to resolve any CSS issues, JavaScipt errors, and whatever other issues arise
Weinre • Web Inspector Remote is another tool to enable debugging on the device • To use it, debugging must be enabled before the App is compiled • The application will be queued for a new build which will have WEINRE debugging available that we can access from our compute • Once created and installed on the device the debug feature of PhoneGapBuild can be used.
Weinre • Once installed, press the debug button in PhonegapBuild • A new window will open weinreand the Target will point to the app • it's not as quite full fledged debugger as Chrome tools • it gives a live view of the DOM and access to the JavaScript console, but no break points or traces are available • The JavaScript console can give clues about errors (press Target) • Can flip over to Elements and start to see our application running on the device • Can see network activity • To disable it, go back to Settings, turn off the checkbox, go ahead, click Save, and it will now rebuild your application with the WEINRE debug features turned off.
Third Party Tools • Another popular tool is GapDebugfrom Genuitec, available for both OSX and Windows
Hydration • PhoneGapBuild has a feature called hydration • Instead of having to recompile the app after every change, hydration instead creates a special native binary that acts as a container for the app • When the app is launched in the device, it checks the PhoneGap Build to see if there's a newer version of the available • If there is, it then updates the app • You don’t need to go through the process of reinstalling the application.
Hydration • To enable this feature, go to the App Setting page and click on Enable Hydration. • Then go ahead and click Save and the app will be rebuilt with this feature enabled • Install this version and launch the application • It will take some time to initialize and launch • When a code change is made, and the app is launched again, it takes a bit longer • a screen will be presented asking if we want to update or install the new version • Updating downloads and installs new code • The main advantage of this solution is it reduces the reinstall times that occurs during the normal development cycle
Wrapup • Only choose one debugging method – do not mix and match • A setting made for WEINRE will cause Chrom Inspect to fail • Make sure all debugging features are disabled when you build your release version of your application