Download
1 / 68
850 likes | 1.27k Views
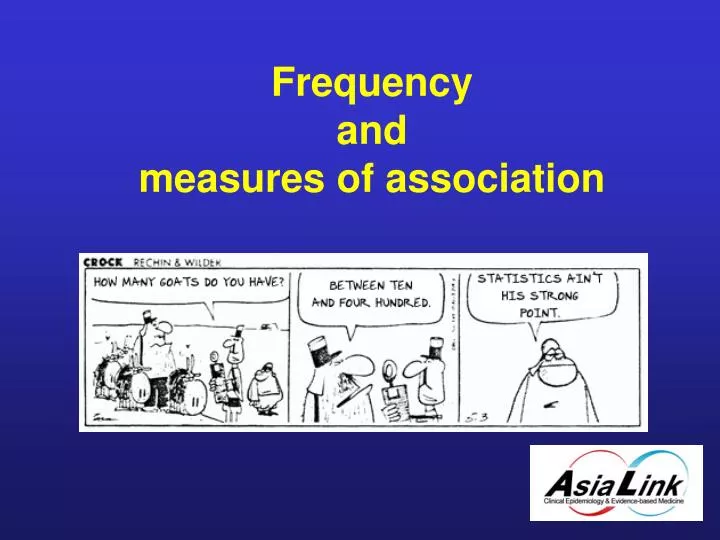
Frequency and measures of association. Lecture Contents. Association - Relative risk - Rate ratio - Risk ratio - Odds ratio - Risk difference. Frequency Prevalence Incidence cumulative Density Precision P value Confidence level. Frequency measures. Two types:

E N D
Lecture Contents • Association • - Relative risk • - Rate ratio • - Risk ratio • - Odds ratio • - Risk difference • Frequency • Prevalence • Incidence • cumulative • Density • Precision • P value • Confidence level
Frequency measures • Two types: • Someone has the disease already: prevalence • Someone gets the disease in the future: incidence
Study Design Direction of inquiry Survey / Cross Sectional TODAY Cohort Case-control Historical cohort
Prospective Cohort Exposure Outcome Start here + ** Free of outcome - * + - to t1
Historical Cohort Exposure Outcome Start here + ** Free of outcome - * + - to t1
Case ControlStart here Exposure Outcome + Case - Population + Control -
Frequency measures: diagnostic research • Suppose: you see a patient with symptoms that possibly point at venous thrombosis • Research question ?
Frequency measures: diagnostic research • Suppose: you see a patient with symptoms that possibly point at venous thrombosis • Research question: What is the probability of venous thrombosis given the physical exam / tests?
Frequency measures: prevalence • Cross-sectional studies • Determinant and disease measured at the same time • Prevalence • Number of persons with the disease at a certain moment
Frequency measures: prevalence • Prevalence (%) = Number of persons with the disease Total population Numerator is part of denominator
Frequency measures: prevalence • Examples • 50% of the persons with a suspicion of lung cancer had a lesion on the thorax X-ray • In a general practice population of 2500 persons, 50 had asthma • 30% of the Dutch people smoke
Frequency measures: prevalence • Interpretation / relevance • Quantification amount of disease: a priori probability • public health planning • Issues • non-response • prevalence of MI • prevalence of dementia • selective mortality
Frequency measures: prognostic research • Suppose: You see a patient with diagnosed breast cancer who asks for her prognosis • Research question?
Frequency measures: prognostic research • Suppose: You see a patient with diagnosed breast cancer who asks for her prognosis • Research question: What is the probability that I die within 5 years / get a relapse?
Frequency measures: Incidence • Incidence • number of new cases • in the population at risk • Two types of incidence • Cumulative incidence • Incidence density
Frequency measuresIncidence • incidence density = # new patients personyears of the population at risk • 10 per 1000 personyears (PY) • between 0 and infinity
Frequency measures: Incidence • Cumulative incidence • new cases in a certain time period in the population at risk (free of the disease at the start) • proportion / probability • varies between 0 and 1 • within certain time period
Frequency measures: Incidence • Cumulative incidence: examples • 5-year risk of a second MI • 10-year survival for women with breast cancer • 1-year risk of a fracture for osteoporotic women
Exercise 1 Ad question 1: tonsillitis • Dutch population • 1 year • incidence • 19/1000 or 1.9%
Exercise 1 Ad question 2: asthma • Children in the general practice • Certain moment (look into practice data at a certain moment) • (point)prevalence
Exercise 1 Ad question 3: breast cancer • Women • Life • Incidence
Exercise 1 Ad question 4: vertebral collapse • 9% • 55-59 year-old men and women • Certain moment • (point)prevalence
Exercise 1 Ad question 5: fractures • Post-menopausal women • Follow-up duration of the study • Incidence
Frequency measures: Incidence • How do we calculate a cumulative incidence?
Frequency measures: Incidence • Cohort approach • Group of persons with the same characteristics • All participants have the same starting point (start cohort) • However, baseline can differ in time • All participants are followed during a certain time period
Frequency measures: example cohort • 13 persons followed for 5 years for mortality • A-----------------------------x--Moves away • B-----------------------------x-------------Death • C-------breast cancer/death • D-----------------------------x------------------------------------------- alive • E-----------------------------x--------lost to follow-up • F-----------------------------x--------------------------------------------alive • G-----------------------------x---------------------------breast cancer/death • H-----------------------------x-Myocardial infarction/death • I--------death • J------------------------------x-------------------------------------------alive • K-------------lost to follow-up • L-----------------------------x----------------moves from the area • M--------1---------------2--x----------3---------------4-------------------alive
Frequency measures: example cohort • CI = 5/13 = 38%
Frequency measuresIncidence: cohort • incidence density • # new patients / personyears of the population at risk • 10 per 1000 personyears • between 0 and infinity
Frequency measures:Incidence: cohort • 5 persons followed during a year • (N at risk = 5) • A------------------------------ • B------------------------------ • C-------------breast cancer • D------------------------------ • E------------------------------ • 1-year risk of breast cancer = CI = 1/5=20% per year • ID = 1/4.5 personyears = 222/ 1000 personyears
Frequency measures:Etiologic research • Suppose: you see a patient with lung cancer, who asks for the possible cause • Research question?
Frequency measures:Etiologic research • Suppose: you see a patient with lung cancer, who asks for the possible cause • Research question: Is smoking a risk factor for lung cancer?
Measures of association • Epidemiology • Disease = f (determinants) • Is the determinant associated with the disease? • Is the probability of disease different for exposed and non-exposed
Measures of association:Cohort approach • Research question? Is smoking associated with lung cancer? • Cohort approach • divide the cohort in smokers and non-smokers • estimate the incidence density (or CI) in each group • prior: ID smokers > ID not smokers
Measures of association: Cohort approach Disease Yes No Yes a - PY1 Determinant No c - PY0 a/py1 RR = c/py0
Measures of association: Cohort approach • Smoking and lung cancer Disease Yes No Yes 440 - 22.008 py Determinant No 212 - 21.235 py RR = (440/22.008) / (212/21.235) = 2.0
Measures of association • Risk difference (RD) between exposed and non-exposed reflects public health impact = CIexposed – CI nonexposed or = IDexposed - CI nonexposed • Risk difference smoking and lung cancer • RD = 20/1000 py - 10/1000 py = 10 / 1000 py
Measures of association:Case Control approach • Research question: Does smoking increase the risk of lung cancer ? • Patient control study • select cases and controls • Estimate the frequency of smoking among cases and controls • prior: % smokers among cases > % smokers among controls
Measures of association: Case Control approach Disease Yes No Yes a b Determinant No c d • RR? • Odds ratio = (a/c) / (b/d) = ad / bc
Measures of association:Case Control approach • Smoking and lung cancer (controls = 10% random sampling from cohort) Disease Yes No Yes 440 300 740 Determinant No 212 350 562 • Odds ratio (440/212) / (300/350) = 2.42 • RR = (440/740) / (212/562) = 1.57 (shouldn’t be calculated)
Measures of association • Smoking and lung cancer Disease Yes No Yes 440 3000 3440 Determinant No 212 3500 3712 • Now entire cohort as control • RR = (440/3440) / (212/3712) = 2.23 • Odds ratio =(440/212) / (3000/3500) = 2.42 • RR (a/(a+b)) / (c/(c+d)) ~ (a/c) / (b/d)
Frequency measures:Therapeutic research • Suppose: you see a patient with an increased blood pressure who you want to treat with blood pressure decreasing drugs. He asks about the effect of this treatment on the prognosis • Research question: Does treatment decrease the probability of CVD?
Frequency measures:Incidence • Intervention study (RCT) • Estimate incidence density (or CI) for each group • prior: ID treated < ID not treated
Exercise 2 • People of age 55 years and older • 5 years • Incidence (probably cumulative) • Relative risk and risk difference
Exercise 2 Risksmokers = 41/1736 = 0.024 Risknon-smokers = 107/5949 = 0.018 - RR = 0.024/0.018 = 1.3 Smokers have a 1.3 x higher probability of CVD than non-smokers • RD = 0.024 - 0.018 = 0.006 Smokers have a 5-year risk of CVD that is 0.6% higher than that of non-smokers
Exercise 3 • Case-control study • Severe head injury • Population • Alzheimer’s disease • Odds ratio
Exercise 3 Severe head injury in the past Alzheimer Yes No Severe Yes 33 31 Head injury No 165 167 OR = (33x167)/(31x165)=1.1
SummaryFrequency and measures of association • Frequency • Prevalence • Incidence • cumulative • density • Association • - Relative risk • - Rate ratio • - Risk ratio • - Odds ratio • - Risk difference