Download
1 / 2
20 likes | 144 Views
Supplemental Fig. 1. A. N = 27. 300. TG (Seq.Test). 250. TG (OTT). 200. ***. ***. Glucose (Seq.Test). 150. TG, Glucose (mg/dl), Insulin (µIU/ml). Glucose (OTT). 100. Insulin (Seq.Test). ***. ***. 50. Insulin (OTT). 0. 0h. 3h. 4h. 5h. B. 300. N = 15. ***. ***. 250.

E N D
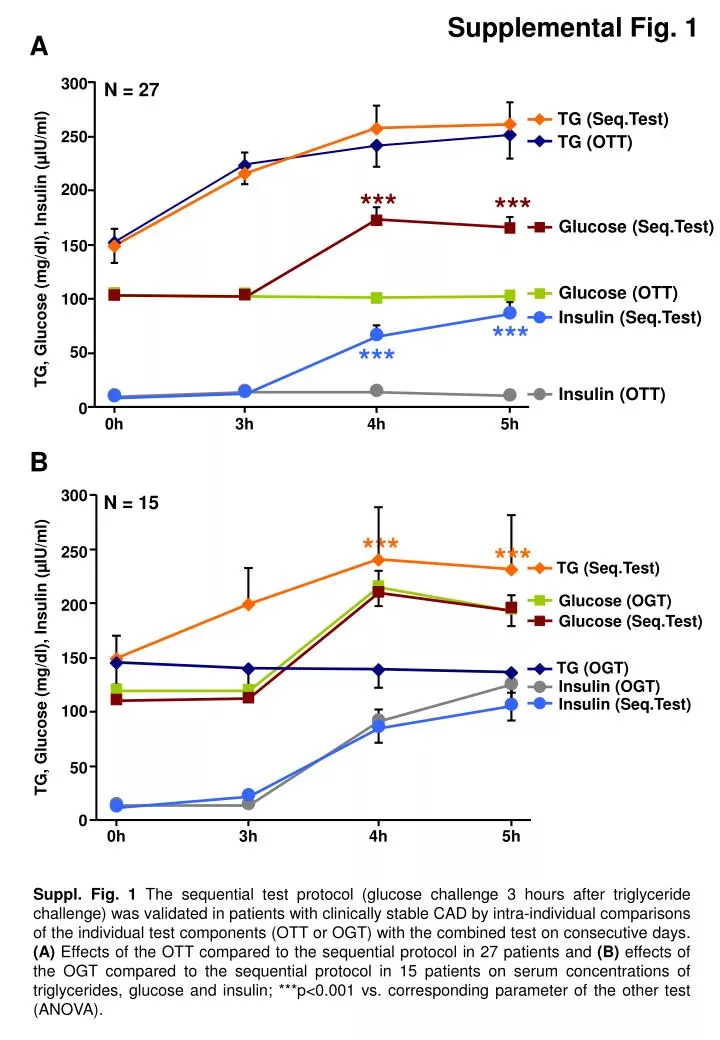
Supplemental Fig. 1 A N = 27 300 TG (Seq.Test) 250 TG (OTT) 200 *** *** Glucose (Seq.Test) 150 TG, Glucose (mg/dl), Insulin (µIU/ml) Glucose (OTT) 100 Insulin (Seq.Test) *** *** 50 Insulin (OTT) 0 0h 3h 4h 5h B 300 N = 15 *** *** 250 TG (Seq.Test) Glucose (OGT) 200 Glucose (Seq.Test) TG, Glucose (mg/dl), Insulin (µIU/ml) 150 TG (OGT) Insulin (OGT) Insulin (Seq.Test) 100 50 0 0h 3h 4h 5h Suppl. Fig. 1 The sequential test protocol (glucose challenge 3 hours after triglyceride challenge) was validated in patients with clinically stable CAD by intra-individual comparisons of the individual test components (OTT or OGT) with the combined test on consecutive days. (A) Effects of the OTT compared to the sequential protocol in 27 patients and (B) effects of the OGT compared to the sequential protocol in 15 patients on serum concentrations of triglycerides, glucose and insulin; ***p<0.001 vs. corresponding parameter of the other test (ANOVA).
Supplemental Fig. 2 Suppl. Fig. 2 Design of the Homburg Cream & Sugar study and metabolic test protocol