Download
1 / 26
570 likes | 1.42k Views
14. CHAPTER. Quality Cost Management. 1. Costs of Quality. OBJECTIVE. A quality product or service is one that meets or exceeds customer expectations. Quality of conformance is a measure of how a product meets its specifications. 1. Costs of Quality. OBJECTIVE. Defining Quality Costs.

E N D
14 CHAPTER Quality Cost Management
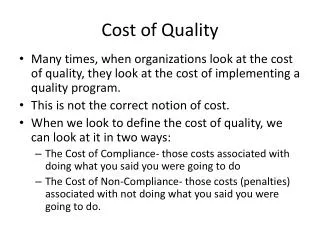
1 Costs of Quality OBJECTIVE A quality product or service is one that meets or exceeds customer expectations. Quality of conformance is a measure of how a product meets its specifications.
1 Costs of Quality OBJECTIVE Defining Quality Costs Prevention costs Appraisal costs Internal failure costs External failure costs
1 Costs of Quality OBJECTIVE • Examples of Quality Costs by Category
1 Costs of Quality OBJECTIVE • Examples of Quality Costs by Category (cont’d)
2 Basic Concepts of the Balanced Scorecard OBJECTIVE • Quality Cost Report aActual sales of $5,000,000. b$1,000,000/$5,000,000 = 20 percent.
2 Basic Concepts of the Balanced Scorecard OBJECTIVE • Quality Cost Categories: Relative Contribution Graphs
2 Basic Concepts of the Balanced Scorecard OBJECTIVE • AQL Quality Cost Graph
2 Basic Concepts of the Balanced Scorecard OBJECTIVE • Zero-Defects Quality Cost Graph
Quality Cost Information and Decision Making 3 OBJECTIVE Strategic Pricing Revenues (1,000,000 @ $20) $20,000,000 Cost of goods sold -15,000,000 Operating expenses - 3,000,000 Product-line income $ 2,000,000
Quality Cost Information and Decision Making 3 OBJECTIVE Strategic Pricing Data from the low-level instruments are: Quality costs (estimated): Inspection of materials $ 200,000 Scrap 800,000 Rejects 500,000 Rework 400,000 Product inspection 300,000 Warranty work 1,000,000 Total estimate $3,200,000
Quality Cost Information and Decision Making 3 OBJECTIVE Reports: New Product Analysis, Project #675 Projected sales potential: 44,000 units Production capacity: 45,000 units Unit selling price: $60 Unit variable costs: $40 Fixed costs: Product development $ 500,000 Manufacturing 200,000 Selling 300,000 Total $1,000,000 Projected break-even: 50,000 units Decision: Reject Reason(s): The break-even point is greater than the production capacity as well as the projected sales volume.
Controlling Quality Costs 4 OBJECTIVE The Total Quality Approach Zero-defect standards reflects a philosophy of total quality control and calls for products and services to be produced and delivered that meet the targeted value.
Controlling Quality Costs 4 OBJECTIVE The Total Quality Approach 1.Progress with respect to a current-period standard or goal (an interim standard report) 2.The progress trend since the inception of the quality-improvement program (a multiple-period trend report) 3. Progress with respect to the long-range standard or goal (a long-range report)
Controlling Quality Costs 4 OBJECTIVE • Interim Quality Performance Report
Controlling Quality Costs 4 OBJECTIVE • Interim Quality Performance Report
Controlling Quality Costs 4 OBJECTIVE • Interim Quality Performance Report
Controlling Quality Costs 4 OBJECTIVE • Interim Quality Performance Report
Controlling Quality Costs 4 OBJECTIVE • Multiple-Period Trend Graph: Total Quality Costs
Controlling Quality Costs 4 OBJECTIVE • Multiple-Period Trend Graph: Individual Quality Costs Categories
Controlling Quality Costs 4 OBJECTIVE • Multiple-Period Trend Graph: Relative Quality Costs
Controlling Quality Costs 4 OBJECTIVE • Long-Range Quality Performance Report
Controlling Quality Costs 4 OBJECTIVE • Long-Range Quality Performance Report
Controlling Quality Costs 4 OBJECTIVE • Long-Range Quality Performance Report
Controlling Quality Costs 4 OBJECTIVE • Long-Range Quality Performance Report