Download
1 / 13
130 likes | 282 Views
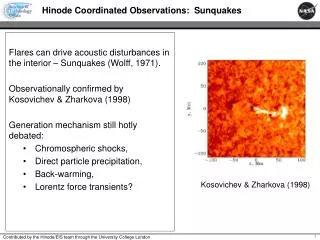
ALFVEN WAVES IN A POLAR CORONAL HOLE FROM HINODE/EIS OFF LIMB OBSERVATIONS Bemporad A. & Abbo L. bemporad@oato.inaf.it – abbo@oato.inaf.it INAF – Turin Astronomical Observatory, via Osservatorio 20, 10025 Pino Torinese (TO), ITALY. Outline. Introduction: off-limb line broadening

E N D
ALFVEN WAVES IN A POLAR CORONAL HOLE FROM HINODE/EIS OFF LIMB OBSERVATIONS Bemporad A. & Abbo L. bemporad@oato.inaf.it–abbo@oato.inaf.it INAF – Turin Astronomical Observatory, via Osservatorio 20, 10025 Pino Torinese (TO), ITALY
Outline • Introduction: off-limb line broadening • EIS observations • Data analysis: EIS stray light, density and non-thermal velocity profiles • Alfvèn waves energy flux • Conclusions
Introduction: past observations Many authors reported that above the limb in both plumes and inter-plume coronal hole regions the spectral line widths increase with altitude and then start to decrease above ~ 0.1 Rsun. (e.g.: Hassler et al. 1990; Banerjee et al. 1998; Lee et al. 2000; O’Shea et al. 2003). (O’Shea et al. 2003) • BUT impact of these results was limited: • x estimate → assumption on unknown Tion (usually it is assumed Tion= Teor Tion = Tmax); • Other authors found: • dependence on line width with formation temperature has been found → no Alfvèn waves (e.g. O’Shea et al. 2004; Singh et al. 2003), • a plateau instead of a line width decrease (e.g. Contesse et al. 2004; Wilhelm et al. 2005 • stray light can affect the observed line widths in SUMER data (Dolla & Solomon 2008). • The main questions I’m going to investigate are: • What is the EIS stray light contribution? • What is the behaviour observed with EIS far from the limb?
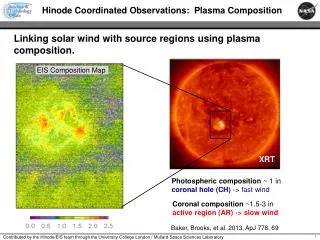
EIS long duration sit & stare observations 40” HINODE/EIS field of view for spatial and temporal rasters SOHO/EIT FeXII 195.12 Y = -906” 512” Y = -1418” SPATIAL RASTER Slit position: Xc = from -46.4” to +33.6”, step by 2” ; Yc = -1162” Slit width: 2” Altitude range: from 0.05 R๏ on disk up to 0.48 R๏ off limb Duration:~ 1 hour Exposure time: 100s SIT & STARE Slit position: Xc = 0” ; Yc = -1162” Slit width: 1” Altitude range: from 0.05 R๏ on disk up to 0.48 R๏ off limb Duration:~ 21.6 hours Exposure time: 500s • Between February 24-25, 2009 an off-limb study of a polar coronal hole has been performed with HINODE/EIS for the first time up to ~ 0.48 Rsun above the limb. • The instrument acquired, in sequence: • ~ 1 hour spatial raster (context study) • ~ 21.6 hours sit & stare • ~ 1 hour spatial raster (context study) • with the following instrumental settings
Observed spectral lines For this study, 10 spectral panels (32 spectral bins per panel) have been acquired centered over the following lines: OVI 184.00, FeXII 186.85, CaXVII 192.82, CaXIV 193.87, FeXII 195.12, FeXIII 202.04, HeII 256.32, FeXIV 264.78, FeXIV 274.77, FeXV 284.16 (→small data volume) Over these spectral intervals, the following Fe lines have been well detected and identified: FeX 193.71, FeXII 195.12, FeXII 193.51, FeXII 186.88, FeXIII 202.04 SPATIAL RASTERS LONG DURATION SIT & STARE Intensity maps show a continuous decrease with time close to the limb (below ~0.25 R๏), probably related to solar rotation.
Averaged line profiles at different altitudes Average over: 1 arcsec 25 arcsecs 125 arcsecs FeXIII l202.04 FeXII l195.12 In order to derive line profiles with a good statistic data have been averaged over the whole observation interval (21.6 h). Resulting profiles show a good statistic, even up to 0.4 R๏ above the limb.
EIS stray light correction (1) FeXII 195.12 FeXIII 202.04 FeX 193.71 Unidentified at 195.41 Spectra acquired in the FeXII l195.12 line show the presence of two more lines at the limb at l194.82 and l195.41; both lines disappear above 100” off-limb. ? ? • IDENTIFICATION of 195.4 line is ambiguous: • Synthetic spectra (CHIANTI v.6.0) show no theoretical or observed lines at l195.4; • Brown et al. (2008): FeX l195.394 (20” off-limb EIS spectra above an AR), Tmax=106.0; • Landi & Young (2009) FeVII l195.415 (on-disk EIS spectra above an AR), Tmax=105.6. The intensity of the l195.41 line decays with altitude much faster than FeXII l195.12 and FeXIII l202.04 lines → we assume that this is not a coronal (FeX), but a transition region line (FeVII)→ we assume that the FeVII intensity observed above the limb is solely due to EISstray light.
EIS stray light correction (2) The stray light contribution I(line)stray of each line is computed as: RESULT:EISstray light negligible (< 10%) above 0.07 R๏
Density estimate The only available lines with density sensitive ratios are FeXII l195.12, l193.51 and l186.88 (186.854+186.887). Nevertheless, densities from 195.12/186.88 and 193.51/186.88 ratios are not reliable for h > 0.1 Rsun (S XI 186.838 blend?) → ne estimated with a different technique: based on G(ne,Te) curves provided by CHIANTI (v.6.0) we derived at any altitude the (n,T) valuesbetter reproducing the FeXII l195.12, l193.51, l186.88 and FeXIII l202.04 line intensities.
Observed vs computed line intensity profiles In order to verify the correctness of ne and Te values, we compa-red the expected (blue line) and the observed (red diamonds) intensi-ties of the Fe lines after the stray light subtraction. Good agreement between the obser-ved and computed line intensities.Determination of FeXII 186.88 more uncertain because of smaller intensities and maybe SXI blend
FeXII 195 FWHM & non-thermal velocity profiles x Non-thermal velocityx has been estimated by assuming: 1) sI= 1.03 pixels,FWHMI= 2.42 pixels(Brown et al. 2008) 2) Tion = 106.1 i.e. Tion = Tmax(FeXII) (Mazzotta et al. 1998). RESULT: x increases with altitude up to ~ 0.2 R๏, then decreases.
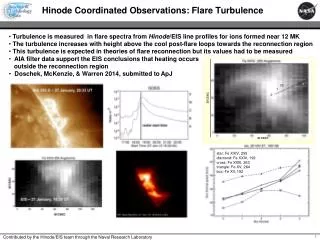
F=8.24×10⁵ erg cm-2s-1 Theoretical curve for undamped waves Alfvèn flux decay above 0.2 R๏ RESULT: the Alfvèn energy flux decays above 0.2 R๏. This is a signature of Alfvèn waves energy deposition in corona Interpretation: Alfvèn waves energy deposition above 0.2 R๏ • Interpretation: • observed non ther-mal velocities x due to Alfvèn waves. • xincrease due to amplitude increase of undamped waves propagating in a den-sity stratified corona. • xdecrease→ Alfvèn waves damping • → energy deposition above 0.2 R๏. The Alfvèn waves energy flux FS is If B×A is constant and FS is conserved: (Moran 2001)
SUMMARY & CONCLUSIONS: • Some previous studies on variation of line profile widths found an increase followed by a decrease of line widths with altitude interpretation: Alfvèn wave energy deposition. Nevertheless, other works found different results and interpretations. • In this work we repeated the same analyses with Hinode/EIS data by performing an off-limb study in a polar coronal hole (FOV for the first time up to 1.48 Rsun). Our main results are: • HINODE/EIS stray light contamination is negligible above 0.07 R๏, hence EIS stray light is not affecting line profile FWHMs above ~ 0.1 Rsun. • By averaging over more than 20 hours, EIS data can be used to infer electrondensity and line profile FWHMsoff-limb up to ~ 0.4 Rsun • FWHM ofFeXII l195.12 line increases up to 0.2 Rsun, then decreases. This can be interpreted as a decay of Alfvèn wave energy flux above that altitude. • Alfvèn waveenergy deposition above ~ 0.2 R๏.