Download
1 / 71
710 likes | 831 Views
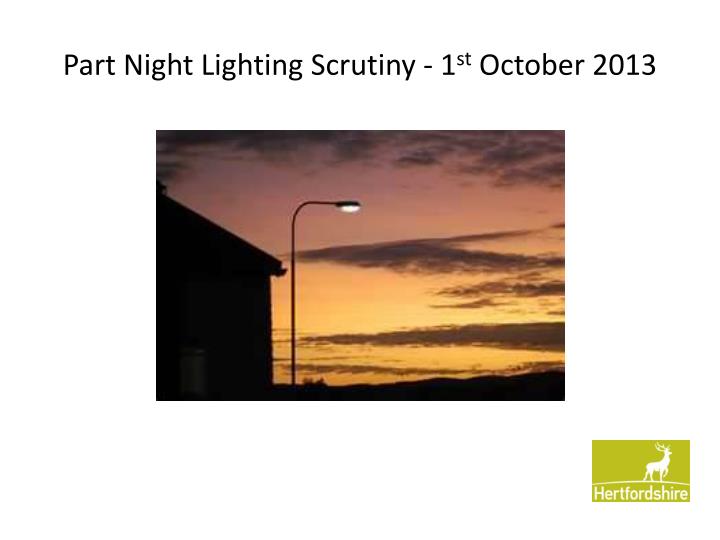
Part Night Lighting Scrutiny - 1 st October 2013. Format of the Meeting Context and Overview – Peter Simpson Project Development/Strategy – Mark Burrows Personal Injury Collision Outcomes – Graham Beviss Hertfordshire Constabulary Review – Mike Rhead

E N D
Format of the Meeting Context and Overview – Peter Simpson Project Development/Strategy – Mark Burrows Personal Injury Collision Outcomes – Graham Beviss Hertfordshire Constabulary Review – Mike Rhead Part Night Lighting in Leicestershire – Peter Hosking
Peter SimpsonSenior Asset ManagerHertfordshire County Council Context and Overview
Context - Key Drivers Economic - Budget Pressures, Private Finance Initiative (PFI) withdrawn, Increasing Energy & Carbon Costs and Efficiencies Agenda Environmental - Reduce Carbon Emissions, Energy Consumption and Light Pollution Social - Road Safety, Crime and Demographics Asset Management - Value for Money, Levels of Service Corporate Objectives - Council for the Future, Reduce Carbon Footprint Legal - Power to Light New Contract - 2012: Holistic Management of Services, Budgets, Programmes & Assets Demands on the Network – Future Development
Corporate Plan Local Transport Plan (LTP3) Transport Asset Management Plan (TAMP) Street Lighting Strategy Part Night Lighting (PNL) Safe & Operational Maintenance Service Highways Street Lighting Service Plan Overview - Structured & Plan Led Approach External Demands HCC Objectives
Overview - 2013/14 Budget Management: Lighting • Lighting: • 10% of Highways budget • 39% (£3.333m) of Lighting budget is cost of energy • 26% reduction in cost of energy due to PNL Source: Highways Service Guide 2013
Real Energy Prices1: 2001-2030 Department of Energy and Climate Change Updated Energy & Emissions Projections - October 2012 based on High Growth
Overview - Asset Management: Carbon Reduction - Lighting • 26.4 % reduction in overall Green House Gas (GHG)emissions (199,798 tonnes of C02ein 2008/09 down to 147,087 tonnes in 2012/13) • Lighting contribution 2012/13: • 11% of gross emissions (total street lighting GHG emissions in tonnes of C02e (16,701) as a percentage of the overall emissions (147,087) for 2012/13) • 15.3% reduction in GHG emissions in tonnes of C02esince 2011/12 (19,723) due to PNL, with an 18.3 % decrease since the base year 2008/09 (20,447). Source: HCC Business Information & Intelligence Unit 2013
Overview - Asset Management: Value - Lighting Asset Group GRC GRC % Carriageway £4,963.4M 72.4% Footways £722.8M 10.5% Structures £864M 12.6% Lighting £125.7M 1.8% Traffic Mgmt. £56.6M 0.8% Street Furniture £124.9M 1.8% Total £6,857.6M 100% The relative value of lighting is less than 2% of the overall highway asset value, but in terms of relative maintenance costs is approximately 10% of the highways budget. The main reason is this asset has a significant energy cost component (39% of the total lighting budget). Source: Transport Asset Management Plan Annual Performance Review 2012 , GRC = Gross Replacement Cost
Overview - Asset Management: Quantity - Lighting Asset Type Quantity GRC Lighting Columns 115,673 £108.04M Subway Lights 3,884 £1.75M Heritage Columns 2,000 £5M Feeder Pillars 1,459 £0.59M Illuminated Bollards 5,734 £2.29 Illuminated Signs 12,360 £8.02M Total * 141,110 £125.7M 2012 Source: Transport Asset Management Plan Annual Performance Review *Excludes High Masts (114 no. classified as structures) and 1200km of underground private electric cable network
Future New Technologies - Light Emitting Diode (LED) Developing invest to save opportunities through the Integrated Planning Process (IPP) Department for Transport (DfT) Highways Maintenance Efficiency Programme (HMEP) - Highway Infrastructure Asset Management - Toolkit for Ancillary Assets includes Street Lighting http://www.dft.gov.uk/hmep/docs/asset-management/130603-HMEP-leaflet.pdf
Mark BurrowsProject ManagerHCC Project Development and Strategy
Pre PNL Position • Budget pressures • Ever increasing energy charges • Environmental requirement to reduce carbon emissions and light pollution • 2010 – approximately 113,000 lighting columns accommodating 118,000 lanterns • Energy consumption was approximately 42m kWh/annum with costs in the region of £4.4m/annum • Carbon emissions were running at around 23,000 tonnes/annum • In addition, annual maintenance costs of £6m/annum
Objectives • Energy consumption was approximately 42m kWh/annum with costs in the region of £4.4m/annum - reduce energy consumption • Carbon emissions were running at around 23,000 tonnes/annum – reduce carbon emissions • Upward light pollution - further reduce light pollution • In addition, annual maintenance costs of £6m/annum – reduce maintenance costs • Deliver a project which met these objectives, but would not have any negative impact with regard to road safety and criminality
Alternative Options Considered in 2010 • Alternatives • De-illumination (taking lights out) – too extreme and costly • Controllable lighting (dimming & trimming) – high capital cost, technology in its infancy – reliability questionable • LED lighting - high capital cost, technology in its infancy – reliability questionable • Part-night lighting (change operation of existing stock) – affordable with robust technology, in addition other local authorities have implemented similar projects • The time of operation for part night lighting (00:00 OFF – 06:00 ON & GMT/BST correcting) • Consideration for leaving alternative lights on • PNL in other County Councils • West Sussex, Buckinghamshire, Leicestershire, Devon, Essex, Suffolk, Gloucester, Hampshire, Powys, Nottinghamshire, Oxfordshire, Derbyshire
Development of Strategy • Clean sheet of paper – no pre-conceptions – develop a risk based strategy appropriate and relevant to Hertfordshire • Acknowledgement that PNL will not be applied to all lighting • Liaise with external agencies/internal departments with regard to the development of ‘exception criteria’ which excludes lights from PNL (lights to remain on throughout the hours of darkness) • ‘A Class’ roads and subways/tunnels would not be considered for PNL
Exception Criteria • In addition, there was further flexibility afforded to elected county council members with regard to: • local alleyways and remote footpaths • small villages and hamlets • Approved by Highways & Transport Cabinet Panel on 11 January 2011
Development of Proposal • To gauge the potential for conversion to part night lighting, a trial area was selected in the north west of Welwyn Garden City, which consisted of 1227 lighting columns • This area was surveyed, with the ‘exception criteria’ applied, which revealed that : • 26% of lanterns would be retained in all night lighting • 74% of lanterns to be converted to part night operation • To reinforce and validate this initial trial, a greater sample was taken across Welwyn & Hatfield and Broxbourne: • A total of 21049 columns were surveyed • 27% of lanterns would be retained in all night lighting • 73% of lanterns to be converted to part night operation • This was the model used to develop the business case, and the process to be applied to all of the 77 electoral divisions within Hertfordshire
Site Survey Process • survey based on individual electoral divisions • drawing marked up with existing column positions (based on PNL default) • all existing lights surveyed (adopted/private) • exception criteria applied and drawing amended • first draft of drawing completed
Consultation Process • Upon completion of the initial survey, the draft PNL proposals were reviewed by: • the local District Chief Inspector of Police • Community Safety Partnerships – CCTV • HCC Road Safety Team • The initial draft PNL proposals were then amended to incorporate these recommendations.
Change Programme survey plots
County Council Member Consultation Process • county council member sent final draft proposal • time to review/consult • meeting to discuss/amend/refine proposal • drawing updated to reflect amendments • this is the drawing from which the ‘on site’ implementation will be based
Project Timetable The project was programmed for commencement in Welwyn &Hatfield during April – June 2011, progressing through the ten districts, finishing in East Herts in September 2012: Welwyn & Hatfield Broxbourne Hertsmere Watford Three Rivers Dacorum St Albans Stevenage North Herts East Herts
Project Outcomes • Project completed in line with the programme – September 2012 – circa 80,000 (68% )of the 118,000 lanterns converted to part night operation • Project implementation costs estimated at £4.56m – actual costs of £3.75m • Energy consumption was approximately 42m kWh/annum with costs in the region of £4.4m/annum - energy consumption has now reduced to 31.5m kWh/annum, with savings £80k/annum higher than the predicted £1.08m, at £1.16m • Carbon emissions were estimated at 23,000 tonnes/annum – which have reduced to circa 17,000 tonnes/annum, as a consequence, £91k carbon tax costs will be avoided from April 2014 (based on £16.00/tonne) • Upward light pollution - further reduction in light pollution achieved as a consequence of lights being extinguished after midnight • In addition, annual maintenance costs of £6m/annum – savings in the region of £220k made as a consequence of extended lamp life • Total payback will be achieved by December 2014 • Impact of PNL with regard to road safety and criminality will be covered by my colleagues
Project Outcomes HCC insurance section received 23 insurance claims during the period (01 September 20011 until end of August 2013) that mention lighting in the description but none of the claims recorded are as a direct result of part night lighting‘.
Future Proofing • HCC currently procure energy at approximately 10 pence/unit (per kWh). The Department of Energy and Climate Change predict that energy will increase by 10% (one pence/kWh) by the start of 2014/15, with further increases at the rate of half a pence to one pence/kWh year on year. • With effect from 1 April 2014 Carbon Tax will be charged at £16.00/tonne, the Chancellor of the Exchequer has indicated that these charges may rise to an estimated £30.00/tonne in 2020
Graham BevissPrincipal EngineerHertfordshire County Council Personal Injury Collision Outcomes
PNL Road Safety Review • This review provides a comparison of Personal Injury Collisions (PIC) recorded in each of the 77 Divisions of Hertfordshire. These collision details are recorded by the police (at the scene) and stored on a HCC database. • The study considers PIC frequency during periods before and after the implementation of PNL.
The study considers PIC recorded on all Hertfordshire roads during the period of PNL (00:00hr to 05:59hr). These collisions represent approximately 6% of the total number recorded annually on the highway network. • A period of 5 years before the implementation of PNL has been assessed. The period after PNL varies according to the implementation programme but is taken up to the end of 2012.
Divisions 8 and 26 have experienced an increase in the frequency of PIC during the period after the implementation of PNL. • These increases are 94% and 230% respectively and further investigation of these collision locations has been undertaken.
PIC review for Division 8 (Bridgewater) • 7 PIC have occurred during the period following PNL. Of those collisions:- • 3 PIC occurred on the motorway network where PNL is not implemented. • 2 PIC occurred on A Class roads where PNL is not implemented. • 2 PIC occurred on other (rural) roads (Buckwood Road, Markyate and Dodds Lane, Piccotts End). Both these sections of road are unlit and therefore unaffected by PNL.
PIC review for Division 26 (Ware South) • 2 PIC have occurred during the period following PNL. Of those collisions:- • 1 PIC occurred on an A Class road where PNL is not implemented. • 1 PIC occurred on a bend in the B1197 (London Road). Some sections of B1197 were included within PNL. However this bend in the road was treated as an exception to PNL and the street lighting at this location has remained in all night operation.
PIC countywide summary • This road safety review has considered the occurrence of PIC during periods “Before” and “After” the implementation of PNL. • Of the 77 Divisions of Hertfordshire, 29 have experienced a higher frequency of PIC during the period “After” the implementation of PNL. • In those 29 Divisions, the following PIC are recorded in sections of road subject to PNL:- • 2 Divisions have 2 PIC recorded • 10 Divisions have 1 PIC recorded • 17 Divisions have 0 PIC recorded • The numbers above need to be considered in relation to the total of 2246 PIC recorded throughout Hertfordshire during the same period.
PIC countywide summary • Extrapolation of the available data to give a full year of “After” data and comparing this to the “Before” period shows a 20% reduction (186 to148) in PIC numbers during the times of PNL in the first year of operation. • It is considered that the data presented does not indicate any significant road safety concerns associated with the implementation of PNL.
Mike RheadHead of Crime and Business PerformanceHertfordshire Constabulary Review of Criminality
Six month periods over a four year time span have been considered: From 1st September 2009 to 28th February 2010 From 1st September 2010 to 28th February 2011 From 1st September 2011 to 29th February 2012 From 1st September 2012 to 28th February 2013 Overnight crime
Recorded crime has fallen Overnight crime
Overnight recorded crime has fallen Overnight crime
What crimes are directly related to PNL? Burglary Theft from person Assault Criminal damage Public order Overnight crime
Burglary Overnight crime
Example at beat level Overnight crime
Other crime types Drugs (possession and supply) Drink driving Sex crimes (historic reporting post Savile) Possession of a weapon Drunk and disorderly Harassment (including malicious communications) Shoplifting Obstruct police Disqualified driving A number of other crimes that have low levels. Overnight crime
Crime levels in Hertfordshire have been falling for a number of years. Overnight crime (between 00:00 and 06:00) at both CSP and County level has also continued to fall. The position at beat level is more varied. Many beats have low crime levels and some of the variation will be natural variance and some may be as a direct consequence of NPL. Whilst there is some variation at beat level there is no overall aggregated increase in criminality at beat level. The evidence does not appear to support the view that PNL has caused an increase in criminality within the county. Conclusion
Leicestershire County CouncilStreet Lighting Energy Reduction ProjectPeter Hosking – County Team Manager,Highway Management Groupwww.leics.gov.uk/lighting