Download
1 / 1
10 likes | 119 Views
ANALYSIS OF UVB SOLAR RADIATION IN C.I.B.A. LABORATORY, SPAIN. J. Bilbao, A. de Miguel, A. Perez-Burgos and P.Salvador Department of Applied Physics, University of Valladolid, Sciences Faculty. Prado de la Magdalena s/n, Valladolid, 47005, Spain 983.423133; juliab@fa1.uva.es. 1 Goals.

E N D
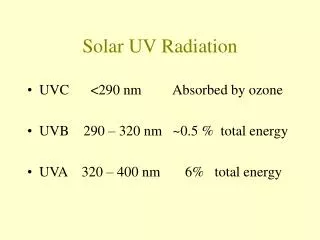
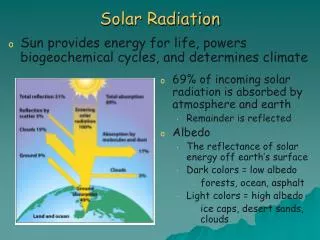
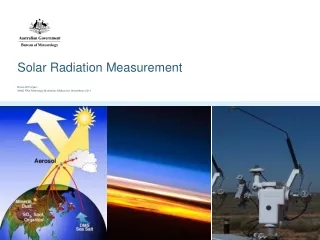
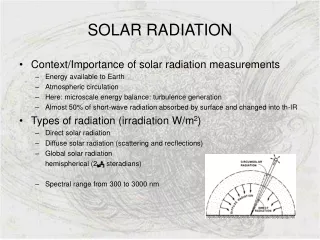
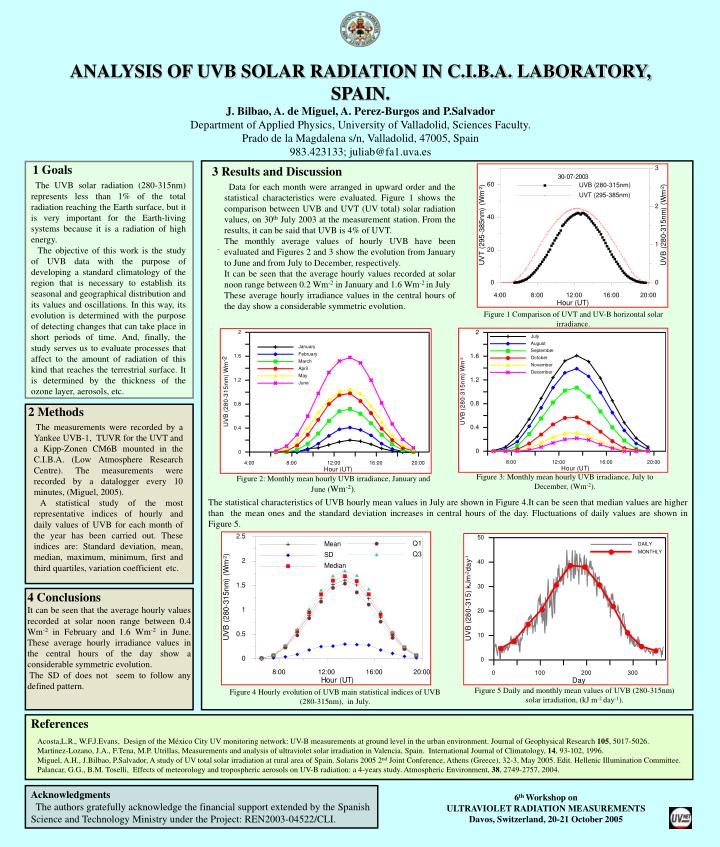
ANALYSIS OF UVB SOLAR RADIATION IN C.I.B.A. LABORATORY, SPAIN. J. Bilbao, A. de Miguel, A. Perez-Burgos and P.Salvador Department of Applied Physics, University of Valladolid, Sciences Faculty. Prado de la Magdalena s/n, Valladolid, 47005, Spain 983.423133; juliab@fa1.uva.es 1 Goals 3 Results and Discussion The UVB solar radiation (280-315nm) represents less than 1% of the total radiation reaching the Earth surface, but it is very important for the Earth-living systems because it is a radiation of high energy. The objective of this work is the study of UVB data with the purpose of developing a standard climatology of the region that is necessary to establish its seasonal and geographical distribution and its values and oscillations. In this way, its evolution is determined with the purpose of detecting changes that can take place in short periods of time. And, finally, the study serves us to evaluate processes that affect to the amount of radiation of this kind that reaches the terrestrial surface. It is determined by the thickness of the ozone layer, aerosols, etc. Data for each month were arranged in upward order and the statistical characteristics were evaluated. Figure 1 shows the comparison between UVB and UVT (UV total) solar radiation values, on 30th July 2003 at the measurement station. From the results, it can be said that UVB is 4% of UVT. The monthly average values of hourly UVB have been evaluated and Figures 2 and 3 show the evolution from January to June and from July to December, respectively. It can be seen that the average hourly values recorded at solar noon range between 0.2 Wm-2 in January and 1.6 Wm-2 in July These average hourly irradiance values in the central hours of the day show a considerable symmetric evolution. . Figure 1 Comparison of UVT and UV-B horizontal solar irradiance. 2 Methods The measurements were recorded by a Yankee UVB-1, TUVR for the UVT and a Kipp-Zonen CM6B mounted in the C.I.B.A. (Low Atmosphere Research Centre). The measurements were recorded by a datalogger every 10 minutes, (Miguel, 2005). A statistical study of the most representative indices of hourly and daily values of UVB for each month of the year has been carried out. These indices are: Standard deviation, mean, median, maximum, minimum, first and third quartiles, variation coefficient etc. Figure 3: Monthly mean hourly UVB irradiance, July to December, (Wm-2). Figure 2: Monthly mean hourly UVB irradiance, January and June (Wm-2). The statistical characteristics of UVB hourly mean values in July are shown in Figure 4.It can be seen that median values are higher than the mean ones and the standard deviation increases in central hours of the day. Fluctuations of daily values are shown in Figure 5. 4 Conclusions It can be seen that the average hourly values recorded at solar noon range between 0.4 Wm-2 in February and 1.6 Wm-2 in June. These average hourly irradiance values in the central hours of the day show a considerable symmetric evolution. The SD of does not seem to follow any defined pattern. Figure 5 Daily and monthly mean values of UVB (280-315nm) solar irradiation, (kJ m-2 day-1). Figure 4 Hourly evolution of UVB main statistical indices of UVB (280-315nm), in July. References Acosta,L.R., W.F.J.Evans, Design of the México City UV monitoring network: UV-B measurements at ground level in the urban environment. Journal of Geophysical Research 105, 5017-5026. Martinez-Lozano, J.A., F.Tena, M.P. Utrillas, Measurements and analysis of ultraviolet solar irradiation in Valencia, Spain. International Journal of Climatology, 14, 93-102, 1996. Miguel, A.H., J.Bilbao, P.Salvador, A study of UV total solar irradiation at rural area of Spain. Solaris 2005 2nd Joint Conference, Athens (Greece), 32-3, May 2005. Edit. Hellenic Illumination Committee. Palancar, G.G., B.M. Toselli, Effects of meteorology and tropospheric aerosols on UV-B radiation: a 4-years study. Atmospheric Environment, 38, 2749-2757, 2004. Acknowledgments The authors gratefully acknowledge the financial support extended by the Spanish Science and Technology Ministry under the Project: REN2003-04522/CLI. 6th Workshop on ULTRAVIOLET RADIATION MEASUREMENTS Davos, Switzerland, 20-21 October 2005