Download
1 / 75
750 likes | 892 Views
Assessing Information from Multilevel (Ordinal) and Continuous Tests. ROC curves and Likelihood Ratios for results other than “+” or “-”. Michael A. Kohn, MD, MPP 10/7/2004. Outline of Topics. Introduce Likelihood Ratio Slide Rule Problem with making tests dichotomous ROC curves

E N D
Assessing Information from Multilevel (Ordinal) and Continuous Tests ROC curves and Likelihood Ratios for results other than “+” or “-” Michael A. Kohn, MD, MPP 10/7/2004
Outline of Topics • Introduce Likelihood Ratio Slide Rule • Problem with making tests dichotomous • ROC curves • Likelihood Ratios for results of non-dichotomous tests If time… • Calculating the “c statistic” • Logarithms and Log Odds
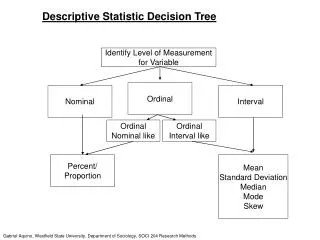
Many Tests Are Not Dichotomous Ordinal • “-”, “+”, “++”, “+++” for leukocyte esterase on urine dip stick • “Normal”, “Low Prob”, “Intermediate Prob”, “High Prob” on VQ scan Continuous • Systolic Blood Pressure • WBC Count
Evaluating the Test--Test Characteristics • For dichotomous tests, we discussed sensitivity P(+|D+) and specificity P(-|D-) • For multi-level and continuous tests, we will discuss the Receiver Operating Characteristic (ROC) curve
Using the Test Result to Make Decisions about a Patient • For dichotomous tests, we use the LR(+) if the test is positive and the LR(-) if the test is negative • For multilevel and continuous tests, we use the LR(r), where r is the result of the test
Clinical Scenario 5-month old boy with fever 39.7. You have the results of a WBC count. How do you use this WBC result to determine whether to treat empirically for possible bacteremia?
Why Not Make It a Dichotomous Test? WBC Count (x1000/uL) Bacteremia No Bacteremia >15 109 2028 0 -14.99 18 6601 Total 127 8629 Lee GM, Harper MB. Risk of bacteremia for febrile young children in the post-Haemophilus influenzae type b era. Arch Pediatr Adolesc Med. 1998;152(7):624-628.
Why Not Make It a Dichotomous Test? Sensitivity = 109/127 = 0.86 Specificity = 6601/11396 = 0.76 LR(+) = 0.86/(1 - 0.76) = 3.65 LR(-) = (1 - 0.86)/0.76 = 0.19
Clinical ScenarioWBC = 16,000/mL (Demonstrate LR Slide Rule) Pre-test prob: 0.03 LR(+) = 3.65 Post-Test prob = ?
Clinical ScenarioWBC = 16,000/mL Pre-test prob: 0.03 Pre-test odds: 0.03/0.97 = 0.031 LR(+) = 3.65 Post-Test Odds = Pre-Test Odds x LR(+) = 0.031 x 3.65 = .113 Post-Test prob = .113/(.113+1) = .10
Clinical ScenarioWBC = 28,000/mL Pre-test prob: 0.03 LR(+) = ? Post-Test prob =?
Clinical ScenarioWBC = 28,000/mL Pre-test prob: 0.03 Pre-test odds: 0.03/0.97 = 0.031 LR(+) = 3.65 (same as for WBC=16,000!) Post-Test Odds = Pre-Test Odds x LR(+) = 0.031 x 3.65 = .113 Post-Test prob = .113/(.113+1) = .10
Why Not Make It a Dichotomous Test? Because you lose information. The risk associated with WBC=16,000 is equated with the risk associated with WBC=28,000. Choosing a fixed cutpoint to dichotomize a multi-level or continuous test throws away information and reduces the value of the test.
Lee GM, Harper MB. Risk of bacteremia for febrile young children in the post-Haemophilus influenzae type b era. Arch Pediatr Adolesc Med. 1998;152(7):624-628.
Histogram • Does not reflect prevalence of D+ (Dark D+ columns add to 100%, Open D- columns add to 100%) • Sensitivity and specificity depend on the cutpoint chosen to separate “positives” from “negatives” • The ROC curve is drawn by serially lowering the cutpoint from highest (most abnormal) to lowest (least abnormal).
10,000/uL 5,000/uL 15,000/uL 20,000/uL Area Under Curve (AUC) = 0.86 25,000/uL 30,000/uL
No Bacteremia Bacteremia 12 18
Test Discriminates Well Between D+ and D- D+ D- Test Result
Test Discriminates Poorly Between D+ and D- D+ D- Test Result
Area Under ROC Curve 10,000/uL 5,000/uL 15,000/uL 20,000/uL Area Under Curve (AUC) = 0.86 25,000/uL 30,000/uL
Area Under ROC Curve Summary measure of test’s discriminatory ability Probability that a randomly chosen D+ individual will have a more positive test result than a randomly chosen D- individual e.g. randomly choose 1 of the 127 bacteremic children and 1 of the 8629 non-bacteremic children. The probability that the bacteremic child’s WBC will fall in a higher WBC interval than the non-bacteremic child is 0.86
Area Under ROC Curve • Corresponds to the Mann-Whitney (Wilcoxan Rank Sum) Test Statistic, which is the non-parametric equivalent of Student’s t test. • Also corresponds to the “c statistic” reported in logistic regression models
“Walking Man” Approach to ROC Curves • Divide vertical axis into d steps, where d is the number of D+ individuals • Divide horizontal axis into n steps, where n is the number of D- individuals • Sort individuals from most to least abnormal test result • Moving from the first individual (with the most abnormal test result) to the last (with the least abnormal test result)…
“Walking Man” (continued) • …call out “D” if the individual is D+ and “N” if the individual is D- • Let the walking man know when you reach a new value of the test • The walking man takes a step up every time he hears “D” and a step to the right every time he hears “N” • When you reach a new value of the test, he drops a stone.
ROC Curve Describes the Test • Describes the test’s ability to discriminate between D+ and D- individuals • Not particularly useful in interpreting a test result for a given patient • Example 1: Child with WBC count = 16,000 • Example 2: Dyspnea patient with BNP = 225 pg/ml
Example 1 Febrile Child with WBC count = 16,000
Example 2 Dyspnea patient with BNP = 225 pg/ml
Likelihood Ratios LR(+) = Sensitivity/(1 – Specificity) = P(+|D+)/(1-P(-|D-)) = P(+|D+)/P(+|D-) LR(-) = (1 – Sensitivity)/Specificity = (1-P(+|D+))/P(-|D-) = P(-|D+)/P(-|D-)
Likelihood Ratios LR(result) = P(result|D+)/P(result|D-)
Likelihood Ratios The ratio of the height of the D+ distribution to the height of the D- distribution 37.8% LR = 37.8%/15.5% = 2.4 15.5%
Likelihood Ratio = Slope of ROC Cuve 10,000/uL 5,000/uL 15,000/uL 37.8% Slope = 37.8%/15.5% = 2.4 15.5% 20,000/uL 25,000/uL 30,000/uL
Common Mistake When given an “ROC Table,” it is tempting to calculate an LR(+) or LR(-) as if the test were “dichotomized” at a particular cutoff. Example: LR(+,10,000) = 97.6/55.6 = 1.8 This is NOT the LR of a particular result (e.g. WBC >10,000 and <15,000); it is the LR(+) if you divide “+” from “-” at 10,000.
Common Mistake 10,000/uL 5,000/uL 15,000/uL 97.6/55.6 = 1.8 20,000/uL 97.6% 55.6%