Download
1 / 19
220 likes | 428 Views
The t Test for Two Independent Samples. What Does a t Test for Independent Samples Mean?. We will look at difference scores between two samples.

E N D
What Does a t Test for Independent Samples Mean? • We will look at difference scores between two samples. • A research design that uses a separate sample for each treatment condition (or for each population) is called an independent-measures research design or a between-subjects design • This is in contrast to repeated measures or within-subjects designs
What Do Our Hypotheses Look Like For These Tests? • Null: • H0: μ1 = μ2 (No difference between the population means) • Same as μ1 - μ2 = 0 • Alternative • H1: μ1 ≠ μ2 (There is a mean difference) • Same as μ1 - μ2 ≠ 0
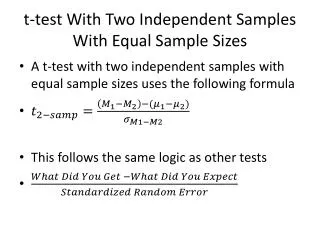
What is the Formula for Two Sample t – tests? • It is actually very similar to the one sample test… • t = [(M1 – M2) – (μ1 - μ2)] / s(M1 – M2) • This says that t is equal to the mean observed difference minus the mean expected difference all divided by the standard error • This begs the question… • What is the standard error for two samples?
What Is the Standard Error for Two Samples? • We know that M1 approximates μ1 with some error • Also, M2 approximates μ2 with some error • Therefore we have two sources of error • We pool this error with the following formula • s(M1 – M2) = √[(s12/n1) + (s22/n2)]
But There Is a Problem… • Does anyone know the problem with this standard error? • It only works for n1 = n2. • When this isn’t the case we need to use pooled estimates of variance, otherwise we will have a biased statistic. • So what we have to do is pool the variance. • What does this mean?
What Is the Pooled Variance of Two Samples? • To correct for the bias in the sample variances, the independent-measures t statistic will combine the two sample variances into a single value called the pooled variance. • The formula for pooled variance is: • sp2 = (SS1 + SS2) / (df1 + df2) • This allows us to calculate an estimate of the standard error
What Is Our New Estimate of Standard Error? • For this we use the pooled variance in place of the sample variance • s(M1 – M2) = √[(sp2/n1) + (sp2/n2)] • What does the pooled standard error tell us? • It is a measure of the standard discrepancy between a sample statistics (M1 – M2) and the corresponding population parameter (μ1 - μ2) • Now all we need are the df.
How Do We Calculate the df? • We need to take into account both samples • df1 = n1 – 1 • df2 = n2 – 1 • Finally, the dftot = df1 + df2
An Example • Group 1 • {19, 20, 24, 30, 31, 32, 30, 27, 22, 25} • n1 = 10 • M1 = 26 • SS1 = 200 • Group 2 • {23, 22, 15, 16, 18, 12, 16, 19, 14, 25} • n2 = 10 • M2 = 18 • SS2 = 160
Step 1: State Your Hypotheses • Null • H0: μ1 = μ2 • Alternative • H1: μ1 ≠ μ2 • State your alpha • α = .05
Step 2: Find tcrit • First find the df • dftot = df1 + df2 = 9 + 9 = 18 • Find the two tailed critical t value for df = 18 and α = .05 • tcrit = 2.101
Step 3: Sample Data and Test Statistics • n1 = 10 • M1 = 26 • SS1 = 200 • n2 = 10 • M2 = 18 • SS2 = 160 • sp2 = (SS1 + SS2) / (df1 + df2) = 20 • s(M1 – M2) = √[(sp2/n1) + (sp2/n2)] = 2 • tobs = [(M1 – M2) – (μ1 - μ2)] / s(M1 – M2) = 4
Step 4: Make a Decision • Is our observed t (tobs) greater than, or less than the critical value for t (tcrit) • 4 > 2.101 • Therefore we make the decision • t(18) = 4.00, p<.05
Effect Size • d = (M1 – M2) / √sp2 • r2 = t2/(t2 + df) • r2 = PRE = variability explained by treatment / total variability
Confidence Intervals • Point Estimate • Interval Estimate
Assumptions! • There are always assumptions underlying statistical tests. • We need to make sure to know these assumptions to make sure we don’t violate them and get misleading results. • So what are the t-test assumptions? • The observations within each sample must be independent. • The two populations from which the samples are selected must be normal. • The two populations from which the samples are selected must have equal variances.