Download
1 / 4
40 likes | 170 Views
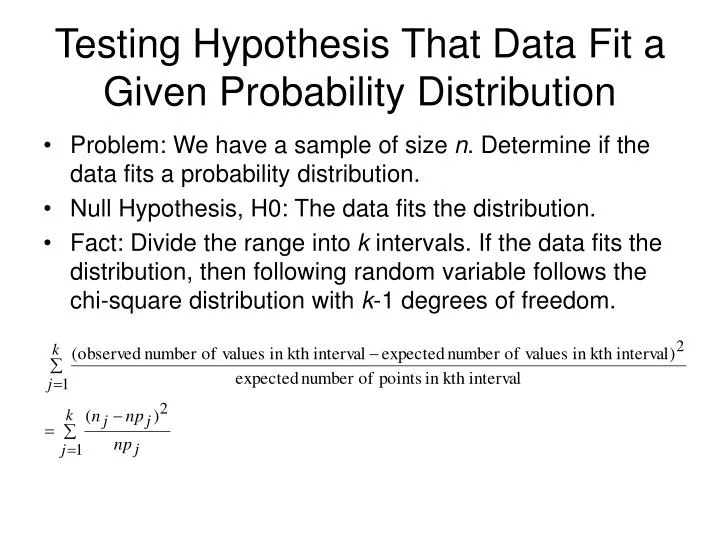
Testing Hypothesis That Data Fit a Given Probability Distribution. Problem: We have a sample of size n . Determine if the data fits a probability distribution. Null Hypothesis, H0: The data fits the distribution.

E N D
Testing Hypothesis That Data Fit a Given Probability Distribution • Problem: We have a sample of size n. Determine if the data fits a probability distribution. • Null Hypothesis, H0: The data fits the distribution. • Fact: Divide the range into k intervals. If the data fits the distribution, then following random variable follows the chi-square distribution with k-1 degrees of freedom.
Testing Hypothesis That Data Fit a Given Probability Distribution • The value of the above variable computed in a hypothesis test is called chi-square statistic. • If chi-square statistic is too large (far in the right tail of the chi-square distribution) this is a surprising result, and it means that the evidence from the test contradicts the hypothesis that the data fit the probability distribution.
Algorithm • Perform visual test first. If there is no reason to reject hypothesis proceed as follows. • Divide range of values in a sample into k adjacent intervals. • Tally the number of observations in each interval. • Calculate the chi-square statistic. • Calculate the p-value of the test. • Decide if the hypothesis should be rejected.
Decision Rule Do not reject H0 Reject H0 • Reject hypothesis if p-value less or equal to some low significance level (e.g. 0.05). Otherwise do not reject hypothesis.