Download
1 / 12
120 likes | 199 Views
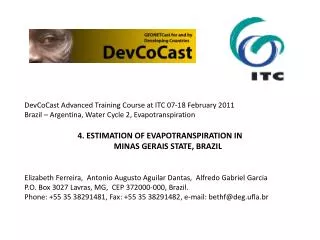
Remote Sensing Applications for Advanced Drought Services: Linking models with in-situ Crop condition. By F. Kuri and I. Gwitira 07 to 18 February 2011. Introduction. Drought is a complex phenomenon with impacts having different time scales.

E N D
Remote Sensing Applications for Advanced Drought Services: Linking models with in-situ Crop condition By F. Kuri and I. Gwitira 07 to 18 February 2011
Introduction DevCoCast Advanced Training Course at ITC 07-18 February 2011 Drought is a complex phenomenon with impacts having different time scales. Spectral Indices from RS have become one of the major tools for monitoring vegetation conditions (McVicar and Jupp, 1998; Kogan, 1990). Healthy vegetation has a different behavior in terms of reflection of electromagnetic radiation in the wavelengths of red (R) and near-infrared(NIR) therefore . NDVI is calculated on a pixel by pixel basis NDVI = (NIR-R)/(NIR+R)
Introduction DevCoCast Advanced Training Course at ITC 07-18 February 2011 In terms of vegetation dynamics, a drought is an event that hampers the normal vegetation growth. In order to capture this effect, and to compare drought conditions in areas with different land cover, NDVI has to be scaled with regard to some measurement of potential vegetation growth for the given crop type and climatic condition Therefore the Vegetation Condition Index (VCI) can be calculated and used to monitor crop condition (Kogan, 1995; Liu and Kogan, 1996).
Vegetation condition Index (VCI) DevCoCast Advanced Training Course at ITC 07-18 February 2011 • . • VCIj is the image of vegetation condition index values for date j; • NDVIj is the image of NDVI values for date j; • NDVImax and NDVImin are images of maximum and minimum NDVI values from all images within the data set; • VCI assesses changes in the NDVI signal through time due to weather conditions, reducing the influence of ‘geographic’ (Kogan, 1990) or ‘ecosystem’ (Kogan, 1995c) variables i.e. climate, soils, vegetation type and topography.
Vegetation condition Index and drought monitoring DevCoCast Advanced Training Course at ITC 07-18 February 2011 It is closely related to the vegetation condition in a specific region. a mechanism to compare values across different landscapes VCI has been used to determine drought and hence poor vegetation growth and corresponding low yields for spring wheat in Kazakhstan (Gitelson et al., 1996; Kogan, 1995b), cotton in China (Kogan, 1995b) and barley production in Southern Russia (Kogan, 1995b)
Data collection DevCoCast Advanced Training Course at ITC 07-18 February 2011 Crop yield data is collected at ward (sub-district) level in Zimbabwe by AGRITEX officers. In situ crop yield data at different levels such as national levels from other SADC members if available can be used to apply the model in the region Landcover map, Ward and Farm boundary maps from the Surveyor General Data from Geonetcast – DevCoCast (SPOT VGT ) NDVI maps
Method and data analysis DevCoCast Advanced Training Course at ITC 07-18 February 2011
Data analysis DevCoCast Advanced Training Course at ITC 07-18 February 2011 All pixels with a VCI value below 36% are considered to be drought condition areas Use the maplist calculation, Iff(@1<0.36,1,0) Sum the total number of dekads in which a pixel was under drought conditions Mask only non-commercial agricultural areas Join the yield data to the dry dekads table Use regression to analyze the relationship between number of dry dekads and the average yield
Nr. of Dry Dekads and Yield Maps Nr. of Dry Dekads Yield (tons/ha) DevCoCast Advanced Training Course at ITC 07-18 February 2011
Results DevCoCast Advanced Training Course at ITC 07-18 February 2011
Conclusion DevCoCast Advanced Training Course at ITC 07-18 February 2011 Remote Sensing Drought Indices can be used to estimate crop yield which is vital to inform the relevant governmental and non-governmental authorities on areas which need drought relief. However, This model still need to be tried with coming seasons and other crops to confirm that in the coming seasons the yields estimated by this model corresponds with the actual yield at reasonable level of accuracy.
THANK YOU DevCoCast Advanced Training Course at ITC 07-18 February 2011