Download

1 / 13
150 likes | 373 Views
The global RTA landscape & Deeper RTAs. Richard Baldwin Graduate Institute, Geneva. Number of RTAs. Number of RTAs rising fast. S-S is growing fastest (many not notified) N-S also growing fast. Most doable N-N have been done. TYPE Almost all are FTA due to sovereignty issues.

E N D
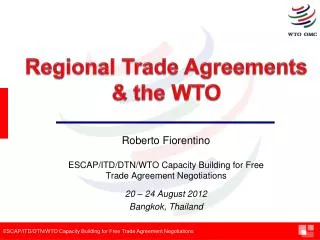
The global RTA landscape& Deeper RTAs Richard Baldwin Graduate Institute, Geneva
Number of RTAs • Number of RTAs rising fast. • S-S is growing fastest (many not notified) • N-S also growing fast. • Most doable N-N have been done. TYPE • Almost all are FTA due to sovereignty issues. • Only 2 types of CUs work: EU & hegemon (e.g. SACU)
Size of RTAs • The new RTAs cover tiny fractions of world trade. • EU + NAFTA = 30% • Add EEA & CH = 1/3 world trade under well-functioning RTAs.
Mercantile interest in RTAs • The big RTAs are important to their members. • Most S-S RTAs are not. • Mercosur & Asean excepted.
Taking the R out of RTA • Most new RTAs are bilaterals. • Used to be almost exclusively regional; most still are, but new trend is cross-region.
CRTA doesn’t work, but … • WTO Soft law • The 90% threshold (standard definition of ‘substantially all’) is shown with a flat solid line. • The rising solid line is the average for RTAs within the Americas • the long dashed line is the average of RTAs that included one Americas nation as a partner • the dotted line shows the average for all RTAs outside of the Americas. Figure 4: Share of tariff lines set to zero in RTAs world wide. Source: Estevadeordal, Shearer and Suominen (2007)
Complexity: Americas Spaghetti Bowl Japan Korea EU, EFTA Bahamas Haiti USA China Canada CAFTA MERCOSUR US-Chile Paraguay Nicaragua Canada-CA-4 Uruguay CACM Chile Costa Rica Mexico ME Brazil El Salvador Guatemala Honduras Argentina Panama Dominican Republic US-PERU, COLOMBIA CARICOM Colombia Trinidad & Tobago Dominica, Suriname, Jamaica, St. Lucia, Belize, St. Kitts & Nevis, Grenada, Barbados, Guyana, St. Vincent & the Grenadines, Antigua & Barbuda Ecuador Bolivia Peru Venezuela AC Thailand ALADI Singapore Australia Source: Estevadeordal et al (2007)
Noodle Bowl Syndrome China, People’s Rep. of Japan Hong Kong, China Korea, Rep. of Taipei,China Myanmar Philippines Cambodia Thailand Indonesia Lao PDR Viet Nam Singapore Malaysia Brunei Darussalam Source: “Managing the Noodle Bowl”, Baldwin (2006)
Complexity multiplier (unbundling) Figure 2: A complex global supply chain example: the Volvo S40 Source: Presentation by Ericsson Chairman Micheal Treschow at the conference.
Complexity multiplier (RoOs & RoCs) • Rules of origin • Especially in ‘spokes’ • Bilateral rules of cumulation • Especially in spokes • Hub as well if complex international supply chain • US exception (so far)
PECS, or ‘Single List’ rules Mongolia Malaysia Afghanistan Ecuador Indonesia Cambodia Peru Vietnam Nepal Colombia Greenland Bhutan Iran Moldova Yemen China Panama Laos Kyrgyzstan Guatemala Tokelau Myanmar Honduras India Uzbekistan El Salvador Bermuda Gibraltar Nicaragua Anguilla Belarus Costa Rica Russia Bosnia & Herzegovina Bolivia Libya Chile Armenia Saudi Arabia Sri Lanka Pakistan Aruba Philippines Paraguay Kazakhstan Argentina Bahrain Azerbaijan Georgia U.A.E Turkmenistan Ukraine Qatar Bangladesh Brazil Thailand Cuba Uruguay Kuwait Maldives Macao Venezuela Tajikistan Oman Iraq ‘Families’ of rules-of-origin ACP Nations (ex. Africa) Caribbean: Antigua & Barbuda, Bahamas, Barbados, Belize, Dominica, Dominican Rep., Grenada, Guyana, Haiti, Jamaica, St Lucia, St Vincent, St. Ch. & Nevis, Surinam, Trinidad & Tobago Pacific: Cook Is., Fed. Micron., Fiji, Kiribati, Marshall Is., Nauru, Niue, Palau, Papua N. G., Samoa, Solomon Is., Tonga, Tuvalu, Vanuatu NAFTA & NAFTA-like rules CACM rules ASEAN rules African ACP Nations + EU bilaterals SADC’s PECS-like rules LAIA & LAIA-like rules in Mercosur EU’s GSP recipients
Hub & Spoke:World direction of trade, 1963 & 2003 Figure 1 1963, World trade flows; 2003, World trade flows; thickness of line thickness of line proportional to % of world proportional to % of world trade trade (bilateral flows less than 2% (bilateral flows less than 2% of world trade rounded to zero) of world trade rounded to zero) 2003 1963 Source: Baldwin (2006) World Economy.