Download
1 / 70
700 likes | 798 Views
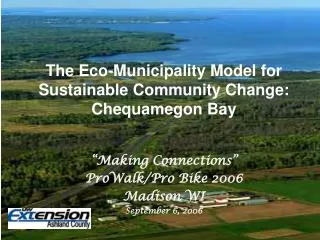
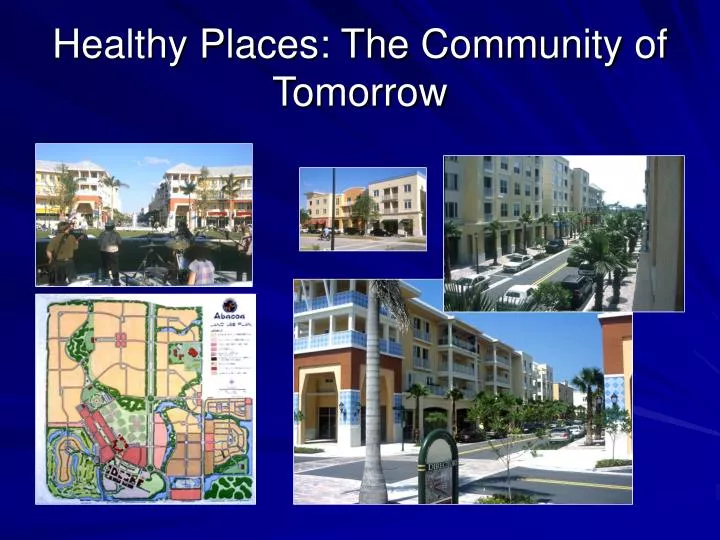
Healthy Places: The Community of Tomorrow. USA Population. 2000 275 million people Median age: 35.8 yrs 2030 351 million people Median age: 39 yrs. Source: US Census Bureau. USA Population (in millions). Source: US Census Bureau. USA Population Median Age. Source: US Census Bureau.

E N D
USA Population • 2000 • 275 million people • Median age: 35.8 yrs • 2030 • 351 million people • Median age: 39 yrs Source: US Census Bureau
USA Population(in millions) Source: US Census Bureau
USA PopulationMedian Age Source: US Census Bureau
USA Population 2000 by Age Groups Source: US Census Bureau
USA Population 2030 by Age Groups Source: US Census Bureau
USA Population 2000-2030 by Age Groups Source: US Census Bureau
Changes with age • Housing • Housing choices change as people age • “Empty Nester” housing • Assisted Living • Transportation • Mobility is decreased • Driving a car eventually is not an option • Decrease of activity can lead to health decline
National Percent Preferring a Townhouse in the City DowellMyers USC School of Policy, Planning, and Development
Percent Calling Factor Very Important if Buying a Home Today DowellMyers USC School of Policy, Planning, and Development
Problems with Zoning • Plans tend to replicate existing trends • Many favor large lot, expensive housing • They are often barriers to higher density uses and rental units • Market cannot respond to needs and changes
Regional Housing Needs Assessment May 2004
Population age 30-54 2000 Housing Patterns – Chicago Region Source: Census Bureau
Population 65+2000 Housing Patterns - Chicago Source: Census Bureau
Population 65+2030 Housing Patterns – Chicago Region A majority of residents in large apartment complexes will be 65 or older
Chicago Region Housing MismatchTrend (NIPC) Projected Need vs. Zoning Supply
Apartment/Condominium • $300 - $1500 rent • urban and suburban • redev, infill and greenfield
Townhouse • Trend = 71,000 units • Matched Demand = 152,000 units • $600 - $2000 • urban and suburban • redev, infill and greenfield
Small Lot Single Family • Trend = 24,000 units • Matched Demand = 202,000 units • $700 - $2500 • urban and suburban • infill and greenfield
Below Market Rent • Matched Demand = 73,000 units • $0 - $500 • urban and suburban • redev, infill and greenfield
Waukegan Strategies Infill in Urban Neighborhoods Station Area Development Capitalize on Lakefront setting in Corridor Development Downtown Revitalization East-West Corridor Enhancement
Pedestrians in the Conventional Suburban Development supporting alternative modes through urban design
Pedestrians: 25th Anniversary of the Moonwalk supporting alternative modes through urban design
What makes people walk? • Walkable Distances
What makes people walk? • Practical Destinations
What makes people walk? • Pleasant and Interesting Environment, a Human Scale
The 2040 Growth Concept • The 2040 Growth Concept results in: • Less Congestion • Less Transportation investment • More walk, bike, and transit trips • What Makes 2040 Work • Mixed use design • Density in proximity to commerce and transit • Mixed age and income neighborhoods