Download

1 / 42
420 likes | 913 Views
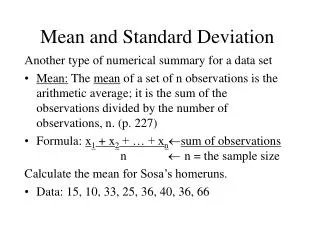
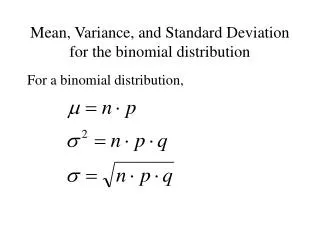
The Population Mean and Standard Deviation. σ. X. μ. Computing the Mean and the Standard Deviation in Excel. μ = AVERAGE(range) δ = STDEV(range). Exercise. Compute the mean, standard deviation, and variance for the following data: 1 2 3 3 4 8 10 Check Figures Mean = 4.428571

E N D
Computing the Mean and the Standard Deviation in Excel μ = AVERAGE(range) δ = STDEV(range)
Exercise • Compute the mean, standard deviation, and variance for the following data: • 1 2 3 3 4 8 10 • Check Figures • Mean = 4.428571 • Standard deviation = 3.309438 • Variance = 10.95238
The Normal Distribution P(-∞ to X) μ X
Solving for P(-∞ to X) in Excel • P(-∞ to X) = • NORMDIST(X, mean, stdev, cumulative) • X = value for which we want P(-∞ to X) • Mean = µ • Stdev = δ • Cumulative = True (It just is)
Exercise in Solving for P(-∞ to X) • What portion of the adult population is under 6 feet tall if the mean for the population is 5 feet and the standard deviation is 1 foot? • Check figure = 0.841345
P(X to ∞) P(X to ∞) μ X
P(X to ∞) P(-∞ to X) P(X to ∞) μ X P=1.0 P(X to ∞) = 1 – P(-∞ to X)
Exercise • What portion of the adult population is OVER 6 feet tall if the mean for the population is 5 feet and the standard deviation is 1 foot? • Check figure = 0.158655
P(X1 to X2) P(X1 < X < X2) X1 X2
P(X1 to X2) in Excel P(X1 to X2) = P(-∞ to X2) - P(-∞ to X1) P(X1 to X2)=NORMDIST(X2…)–NORMDIST(X1…)
Exercise in P(X1 to X2) in Excel • What portion of the adult population is between 6 and 7 feet tall if the mean for the population is 5 feet and the standard deviation is 1 foot? • Check figure = 0.135905
Computing X P(-∞ to X) μ X
Computing X in Excel • X = NORMINV(probability, mean, stdev) • Probability is P(-∞ to X)
Exercise in Computing X in Excel • An adult population has a mean of 5 feet and a standard deviation is 1 foot. Seventy-five percent of the people are shorter than what height? • Check figure = 5.67449
Z Distribution μ = 8 σ = 10 μ= 0 σ = 1 X Z 8 8.6 0 0.12 P(X < 8.6) P(Z < 0.12) A transformation of normal distributions into a standard form with a mean of 0 and a standard deviation of 1. It is sometimes useful.
Computing P(-∞ to Z) in Excel • Z = (X-μ)/δ • P(-∞ to Z) = NORMDIST(Z, mean, stdev, cumulative) • Mean = 0 • Stdev = 1 • Z = (X-μ)/δ • Cumulative = True (It just is)
Exercise in Computing P(-∞ to Z) in Excel • An adult population has a mean of 5 feet and a standard deviation is 1 foot. Compute the Z value for 4.5 feet all. What portion of all people are under 4.5 feet tall • Z check figure = -.5 (the minus is important) • P check figure = 0.308537539
Z Distribution μ = 8 σ = 10 μ= 0 σ = 1 X Z 8 8.6 0 0.12 P(X < 8.6) P(Z < 0.12) A transformation of normal distributions into a standard form with a mean of 0 and a standard deviation of 1. It is sometimes useful.
Computing Z in Excel • Z for a certain value of P(-∞ to Z) =NORMINV(probilility, mean, stdev) • Probability = P(-∞ to Z) • Mean = 0 • Stdev = 1 • Change the Z value to an X value if necessary • Z = (X-μ)/δ, so • X = µ + Z δ
Exercise in Computing Z in Excel • An adult population has a mean of 5 feet and a standard deviation is 1 foot. 25% of the population is greater than what height? • Check figure for Z = 0.67449 • Check figure for X = 0.308537539
Sampling Distribution of the Mean Normal Population Distribution δ is the Population Standard Deviation Normal Sampling Distribution (has the same mean) δXbar is the Sample Standard Deviation. δXbar = δ/√n δXbar << δ
Sampling Distribution of the Mean • For the sampling distribution of the mean. • The mean of the sampling distribution is Xbar • The standard deviation of the sampling distribution of the mean, δXbar, is δ/√n • This only works if δ is known, of course.
Exercise in Using Excel in the Sampling Distribution of the Mean The sample mean is 7. The population standard distribution is 3. The sample size is 100 Compute the probability that the true mean is less than 5. Compute the probability that the true mean is 3 to 5
Confidence Interval if δ is Known X units: Lower Confidence Limit Xmin PointEstimatefor Xbar Upper Confidence Limit Xmax Using X
Confidence Interval • 95% confidence level • Xmin is for P(-∞ to Xmin) = 0.025 • Xmax is for P(-∞ to Xmax) = 0.975 • X = NORMINV(probability, mean, stddev) • Here, stdev is δXbar = δ/√n
Exercise • For a sample of 25, the sample mean is 100. The population standard deviation is 50. • What is the standard deviation of the sampling distribution? • Check figure: 10 • What are the limits of the 95% confidence level? • Check figure for minimum: 80.40036015 • Check figure for maximum: 119.5996
Confidence Interval if δ is Known Zα/2 = -1.96 Zα/2 = 1.96 Z units: 0 Done Using Z
Confidence Intervals with Z in Excel • Xmin = Xbar – Zα/2 * δ/√n • Why? • Because multiplying a Z value by δ/√n gives the X value associated with the Z value • Xmax = Xbar + Zα/2 * δ/√n • Common Zα/2 value: • 95% confidence level = 1.96
Exercise in Confidence Intervalswith Z in Excel • The sampling mean Xbar is 100. The population standard deviation, δ, is 50. The sample size is 25. What are Xmin and Xmax for the 95% confidence level? • Check figure: Zα/2 = 1.96 • Xmin = 80.4 (same as before) • Xmax = 119.6 (same as before)
Confidence Intervals, δ Unknown • Use the sample standard deviation S instead of δXbar. • No need to divide S by the square root of n • Because S is not based on the population δ • Use the t distribution instead of the normal distribution.
Computing the t values • Z = TINV(probability, df) • probability is P(-∞ to X) • df = degrees of freedom = n-1 for the sampling distribution of the mean. • Xmin = Xbar – Z(.025,n-1)*S • Xmax = Xbar + Z(.975,n-1)*S
Exercise • For a sample of 25, the sample mean is 100. The sample standard deviation is 5. • What is Z for the 95% confidence interval? • Check figure 2.390949 • What is the lower X limit? • Check figure 88.04525 (With δ known, was 80.40036015) • What is the upper X limit? • Check figure 111.9547 (With δ known, was 119.5996)
t test for two samples What is the probability that two samples have the same mean?
The t Test Analysis Go to the Data tab Click on data analysis Select t-Test for Two-Sample(s) with Equal Variance
With Our Data and .05 Confidence Level t stat = 0.08 t critical for two-tail (H1 = not equal) = 2.18. T stat < t Critical, so do not reject the null hypothesis of equal means. Also, α is 0.94, which is far larger than .05
t Test:Two-Sample, Equal Variance If the variances of the two samples are believed to be the same, use this option. It is the strongest t test—most likely to reject the null hypothesis of equality if the means really are different.
t Test:Two-Sample, Unequal Variance • Does not require equal variances • Use if you know they are unequal • Use is you do not feel that you should assume equality • You lose some discriminatory power • Slightly less likely to reject the null hypothesis of equality if it is true
t Test:Two-Sample, Paired In the sampling, the each value in one distribution is paired with a value in the other distribution on some basis. For example, equal ability on some skill.
z Test for Two Sample Means Population standard deviation is unknown. Must compute the sample variances.
z test Z value is greater than z Critical for two tails (not equal), so reject the null hypothesis of the means being equal. Also, α = 2.31109E-08 < .05, so reject. Data tab Data analysis z test sample for two means
Exercise Repeat the analysis above.