Download
1 / 27
280 likes | 514 Views
Measuring and analyzing customer satisfaction. Kan , Ch 14 Steve Chenoweth, RHIT. Recall from Week 1. CSSE576 Learning Outcomes: Acceptance Effectively verify customer satisfaction . On-site and beta testing Customer surveys Analyzing data. And from Week 2.

E N D
Measuring and analyzing customer satisfaction Kan, Ch 14 Steve Chenoweth, RHIT
Recall from Week 1 CSSE576 Learning Outcomes: Acceptance • Effectively verify customer satisfaction. • On-site and beta testing • Customer surveys • Analyzing data
And from Week 2 How do we know if it’s “quality”? • Mean time to failure • Defect density • Customer problems • Customer satisfaction… Do you see “quality” here?
Customer Satisfaction Metrics • Often a 5-point scale: • Can be overall, or • For specific qualities. • HP uses “FURPS”: • Functionality • Usability • Reliability • Performance • Service Week 2, cntd
Customer Sat • Can be expressed to the customer as a question, in different ways: • Completely satisfied? • Satisfied? • Dissatisfied? • Neutral or worse? Most commonly asked for Week 2, cntd
Relative scope of the 3 metrics • These are subset relationships Week 2, cntd
And from Week 7 (last week) Why availability? • In Ch 14 to follow, Kan shows that, in his studies, availability stood out as being of highest importance to customer satisfaction. • It’s closely related to reliability, which we’ve been studying all along. Right – We’re not the only ones with availability problems. Consider the renewable energy industry!
So, on to cust sat proper! • The ultimate validation of quality. • Tom Demarco claims thatMicrosoft Word is a GreatProduct. Why? • So many people use it. • TQM: Customer satisfaction is the direct link with ongoing use. • A leading indicator offuture sales. Wham-O! A great product in action, 1957. 25 Millionwere sold in under 4 months.
It’s a real thing (psychologically) • Starts with customer expectations prior to purchase. “Anticipated performance.” • Could be, say (Miller, 1977): • Ideal • Expected • Minimum tolerable • Desirable • Link is to perception of filling that need after purchase. • Does it perform “as expected”?
The Disconfirmation Model • Compares expectations and perceived product performance. • Traditional paradigm is based on: • Expectations • Performance • Disconfirmation • Satisfaction • A sum of satisfactions over the features used. • Has both cognitive and affective components. CS = Customer Sat. The “Disconfirmation” proves indirectly the two ? Relationships.
Two marketing events are involved • Retaining existing customers • Targeting non-customers (5 times more costly): • Why do they buy? Hedonic and utilitarian values: • Sensory and experiential • Over time, instrumental and functional qualities prevail. Right – Long view: is it all justutilitarian?
Can you do better? • In the 1990’s, at NCR, we tried for “customer delight.” • Found it’s mighty hard to sustain! Right – Here’s the problem:
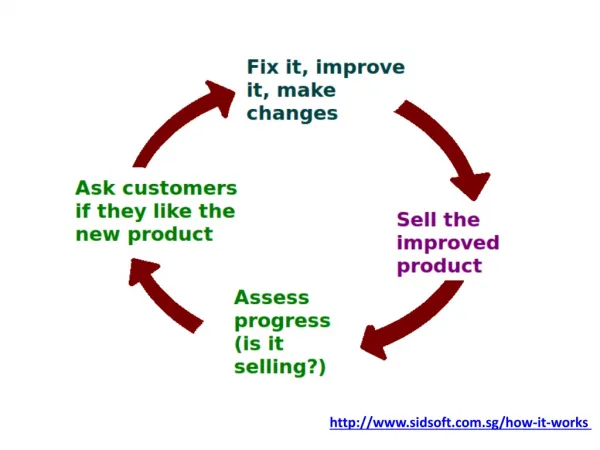
Use surveys to measure? • Maybe you already have the data? • Ongoing customer relationships with marketing • Complaint data • Customer visits • Customer advisory councils & user conferences • Trouble tickets • Or, it’s time for a survey!
Different methods different results • Face-to-face • Personal interview • Focus groups • Telephone interviews • Mailed questionnaires • Emailed questionnaires
Face-to-face • High validity • You can read facialexpressions and gestures. • Easy to ask follow-upquestions. • Can use exhibits to aidin explanations • But, interviewers alsotend to deviate fromthe agenda as theybuild a personal relationship! “So, how do you like your new car sound system?” – Asked better if they were in the car?
Telephone interviews • Less expensive • Easy to monitor for quality • Can be computer-aided • Easier to keep short • More balkers Say, how about those new servers in the cloud!?
Mailed / emailed • Looks like junk mail • Low response rates • Respondents may differ from those ignoring • Questionnaire must be pre-validated • Need professional knowledge and experience • How do you “sample” a large customer base? • It’s an art form
What rating scale to use? • Most common: • Very satisfied • Satisfied • Neutral • Dissatisfied • Very dissatisfied • Then look at thedistribution ofresponses… The satisfied customer in action. Wait! They aren’t using the product!
How to you act on the data? • Hard to know if it’s all global. • So, you should’ve picked things that will enable this! • What areas of strength and weakness could you use for quality improvements? • Interpretation is an art: • High satisfaction with reliability and low satisfaction with documentation – does not necessarily mean you should work on the latter!
How about organizational sat? • This can color satisfaction with products. • Satisfaction and loyalty could be primarily company-based. • Support and service span products. • Marketing does, too! • Company image is considered.
How good is good enough? • Need to consider effect of trends over time.
Recommendations for small orgs • Post-purchase call back program • Complaint management process* • Customer satisfaction survey program *Likely to be most important! • Leverage the benefits of customer involvement in: • Requirements • Design • Functional verification test • Various forms of customer testing