Download
1 / 14
140 likes | 241 Views
NOAA P-3 Status for BAMEX. 148 flight hours approved 20 May - 6 July Chief Scientists: Jorgensen: 20 May - 6 July, except 27-30 May & 22-24 June ( maybe ) Ziegler: 20 May - 3 June Smull: 2 June - 24 June Doppler Scientists:

E N D
NOAA P-3 Status for BAMEX • 148 flight hours approved • 20 May - 6 July • Chief Scientists: • Jorgensen: 20 May - 6 July, except 27-30 May & 22-24 June (maybe) • Ziegler: 20 May - 3 June • Smull: 2 June - 24 June • Doppler Scientists: • Jorgensen: 20 May - 6 July, except 27-30 May & 22-24 June (maybe) • Ziegler: 20 May - 3 June • Smull: 2 June - 24 June • Cloud Physics Scientists: • Greg McFarquhar • Robert Rauber • Brian Jewett
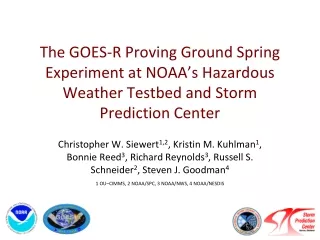
Key P-3 Objectives • NOAA P-3: • Airborne Doppler radar mapping of 3-D flows • Cloud Physics observations from ~5°C to ~-15°C • Multiple snapshots of rear inflow system structure • Coordinated legs with NRL P-3 where possible (quad Doppler) • Straight-line flight tracks in bow-echo “rear” at 18,000 ft (~-15°C) • NRL P-3: • Airborne Doppler (ELDORA) radar mapping of convective line • Multiple snapshots • Coordinated legs with NOAA P-3 where possible (quad-Doppler) • Flight level as low as practical • Straight-line flight tracks best
Aircraft Hazards • NOAA P-3: • Lightning strikes near 0°C! • Wind shear at base of anvil near top of rear inflow • Aircraft charging in ice • Icing in strong stratiform regions • NRL P-3: • Strong convection near leading edge - avoid in spite of no LF radar! • Tracks within ~5 na mi. of leading edge • Tornadic activity usually from the apex of the bow northward and in “tail end charlie” supercells. • Dropsonde Jet • Avoiding leading line convective cells
Airborne Doppler Scanning ELDORA ~400 m Pseudo-dual-Doppler Analysis: w from vertical divergence integration with w=0 @ echo top
Optimal range for Doppler Analysis To minimize vertical velocity contamination on radial winds need to keep scanning angles < 45° R should be > h-RA Example: h~10 na mi. (50kft) RA ~ 5 na mi. (25kft) R ~ 5 na mi. H ~ 10 na mi. (50kft) RA ~ 1 na mi. (5kft) R ~ 9 na mi. RA
Squall Line Example - “Quad-Doppler” Example from TOGA COARE [Jorgensen et al. 1997] NOAA P-3 NOAA P-3
NOAA P-3 Flight Strategies • Basic Doppler survey module (twin legs) at 18,000 feet to facilitate switching to microphysics modules. • Complete survey in 45 min or less • Microphysics modules by NOAA P-3 will be attempted in suitable regions • Attempt at least 2 legs ~70 km system relative separation (~38 na. mi). Doppler coverage overlap of ~10 km • Where possible coordinate legs with NRL P-3
System Relative Tracks Sys Rel (u=0) u=20 knts u=40 knts u=60 knts 38 nm a
Microphysical Modules (NOAA P-3) • ~22 - 45 min flight pattern modules in well-developed stratiform rain regions • Lagrangian spirals • Descent rate ~ 1 m/s above 0°C, ~ 5 m/s below • Standard rate turn (~22° bank angle) • Wind is allowed to advect aircraft • Descend from ~-10°C (~6 km) through the melting level (~4 km) to as low as practical • Requires ~22-45 minutes depending on vertical extent • Perform several times • As an alternative, could fly Doppler legs at different altitudes • Either line parallel or line perpendicular oriented flight legs could be flown
Possible Flight Module Sequence ~50 na mi 42 min 33 min 45 min ~2 hrs For 6 hour on-station time ~ 3 sequences of above
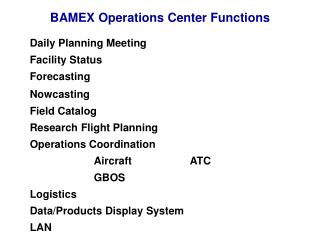
Flight Direction Strategies • Each aircraft has a Chief Scientist • Ops Director and Nowcaster at Ops Center • Must have reliable sat com for information exchange between these groups • Email messages • ftp of gif images • Voice (if necessary) • Ops Center to provide general guidance as to region to investigate, including suggesting end points of flight legs • Chief Scientists will fix flight legs to optimize best tracks for objectives
NOAA P-3 – Ops Center Comms Global-Star, 9600 baud PPP link,:ftp, e-mail B • Observation reports • Radar images A • Flight track guidance • Hourly nowcast & short-term forecasts • Satellite & radar images
Go/No Go Flight Decision • Proposal: • While at or above flight optimum flight utilization curve flight decisions will be relatively conservative (i.e., aircraft launch will be predicated on observing mesoscale organization and behavior) 100 % used 0 20 May 6 July Project Days