Download
1 / 45
470 likes | 1.08k Views
Microwave Spectroscopy in Skin Cancer Detection and Diagnosis Thomas A. Ricard University of South Florida Major Advisor: Dr. Thomas Weller Co-Advisor: Dr. Jeffrey Harrow. Microwave Spectroscopy in Skin Cancer Detection and Diagnosis. Introduction / Prior Research Methodology

E N D
Microwave Spectroscopy in Skin Cancer Detection and Diagnosis Thomas A. Ricard University of South Florida Major Advisor: Dr. Thomas Weller Co-Advisor: Dr. Jeffrey Harrow Microwave Spectroscopy in Skin Cancer Detection and Diagnosis
Introduction / Prior Research • Methodology • Refinements • Future Directions • Milestone Estimates • Future Work / Further Applications • References • Acknowledgements and Thanks Microwave Spectroscopy in Skin Cancer Detection and Diagnosis
Introduction • Three known types of skin cancer: • Basal Cell Carcinoma • Squamous Cell Carcinoma • Malignant Melanoma Malignant melanoma accounts for 5% of skin cancer incidences, but is responsible for 71% of skin cancer deaths! [1] Microwave Spectroscopy in Skin Cancer Detection and Diagnosis
Introduction Our Goal: To use microwave illumination to detect and classify skin lesions as cancerous or non-cancerous, benign or malignant, using a non-invasive, real-time system that will reduce the need for excision and biopsy. Microwave Spectroscopy in Skin Cancer Detection and Diagnosis
Introduction • Prior Research • Low Frequency Impedance Spectroscopy [2]: • Measurement of skin impedance at various frequencies (from 1 KHz to 1 MHz) • Some differentiation found between lesions and malignancies • Results insufficiently conclusive for a “stand-alone” test Microwave Spectroscopy in Skin Cancer Detection and Diagnosis
Introduction Prior Research Probe used in impedance spectroscopy measurements Consists of four concentric electrodes Outer electrode diameter approximately 10 mm Reference [3] Microwave Spectroscopy in Skin Cancer Detection and Diagnosis
Introduction Prior Research Impedance data comparing benign lesions to basal cell carcinoma. Overlapping S.D. markers demonstrate insufficient differentiation. Reference [3] Microwave Spectroscopy in Skin Cancer Detection and Diagnosis
Introduction Prior Research High Frequency Lightwave Technology [4] • Analyzes spectrum of reflected visible & infrared light waves Relatively simple, since only surface characteristics can be studied Microwave Spectroscopy in Skin Cancer Detection and Diagnosis
Introduction Prior Research Spectral data comparing benign and cancerous skin lesions. Malignancy indicated by spectral “dip” at 580 nm. Reference [4] Microwave Spectroscopy in Skin Cancer Detection and Diagnosis
Introduction Prior Research • Relatively low depth of penetration • Tissue reflectance coefficients increase with frequency • Reference [5] Reflectance Frequency Wavelength(nm) Microwave Spectroscopy in Skin Cancer Detection and Diagnosis
Introduction Our Research • Using microwave radiation to illuminate areas of the skin: • Higher frequency than impedance spectroscopy • Less ambiguous results • Lower frequency than lightwave technology • Less attenuation vs. depth of penetration Microwave Spectroscopy in Skin Cancer Detection and Diagnosis
Introduction Why Use Microwave Frequencies? Successes in Related Research: El-Shenawee, January 2004 [6] Differences in dielectric properties of normal and malignant breast tissues at microwave frequencies. Microwave Spectroscopy in Skin Cancer Detection and Diagnosis
Introduction Why Use Microwave Frequencies? Successes in Related Research: Hagness et al., August 2003 [7] Microwave imaging of closely- spaced breast tumor phantoms Microwave Spectroscopy in Skin Cancer Detection and Diagnosis
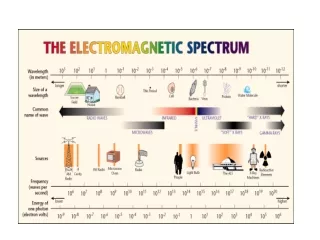
Introduction Microwave Radiation: Between Impedance Spectroscopy and Lightwave Technology http://imagers.gsfc.nasa.gov/ems/waves3.html Microwave Spectroscopy in Skin Cancer Detection and Diagnosis
Methodology • Concept of Electromagnetic Reflections: • Well-known and understood aspect of electromagnetic field theory • Similar to the reflection and transmission of lightwaves • Also analogous to audio reverberations, or echoes Microwave Spectroscopy in Skin Cancer Detection and Diagnosis
Methodology Theory of Multiple Reflections: Signals reflect when medium characteristics change Reference [8] Microwave Spectroscopy in Skin Cancer Detection and Diagnosis
Methodology “Proof-of-Concept” Block Diagram • Non-biological samples • Known electrical properties • Single frequency (10 GHz) Microwave Spectroscopy in Skin Cancer Detection and Diagnosis
Methodology “Proof-of-Concept” Data Analysis X-Band Horn Antenna Gain 23 dB Half - Power Beamwidth 12.8° @ 10 GHz Microwave Spectroscopy in Skin Cancer Detection and Diagnosis
Methodology “Proof-of-Concept” Data Analysis Determining Apparent Voltage Reflection Coefficient (A) • Return Loss: RL = -20 log (Reflected Voltage / Incident Voltage) • Return Loss corrected for system losses (SL 15.3 dB, verified • by analysis and direct measurement • of cabling and switching losses) • Convert to voltage ratio: A =10- (RL-SL)/20 Microwave Spectroscopy in Skin Cancer Detection and Diagnosis
Methodology “Proof-of-Concept” Data Analysis Far- Field A Approximation: A =(G)1/2 (4)3/2R2 [9] Antenna Response from Flat- Plate Reflector Microwave Spectroscopy in Skin Cancer Detection and Diagnosis
Methodology “Proof-of-Concept” Data Analysis Far- Field Approximation Antenna Response from Flat- Plate Reflector Microwave Spectroscopy in Skin Cancer Detection and Diagnosis
Methodology “Proof-of-Concept” Data Analysis To verify test setup Why this exercise? To verify test methods To verify analysis methods The good news: Good fit between measurements and far-field data Good radar cross-section correlation Measured = 38.1 dBsm Analytical = 42.4 dBsm [9] Microwave Spectroscopy in Skin Cancer Detection and Diagnosis
Methodology “Proof-of-Concept” Data Analysis • Test setup mimics a network analyzer • Return Loss = -20 log (Reflected Voltage / Incident Voltage) • Return Loss corrected for system losses ( 15.3 dB, verified • by analysis and direct measurement of cabling and switching losses) • Comparison to Advanced Design Systems simulations using • Ideal Transmission Lines • Correction does not account for signal spreading losses and • field of view (antenna-to-sample, sample-to-antenna) Microwave Spectroscopy in Skin Cancer Detection and Diagnosis
Methodology “Proof-of-Concept” Test Data • TABLE 1 • SINGLE LAYER/COMBINATION DIELECTRIC SAMPLE RETURN LOSS • Material(s) AnalyticalMeasured Agreement • RT6006 8.88 dB 9.98 dB +1.10 dB • TMM101 10.75 dB 9.80 dB -0.95 dB • RT 6006/RT5880 11.93 dB 10.97 dB -0.96 dB • TMM101/RT5880 11.94 dB 11.21 dB -0.73 dB • Non-biological samples • Known electrical properties • Single frequency (10 GHz) Microwave Spectroscopy in Skin Cancer Detection and Diagnosis
Methodology “Proof-of-Concept” Test Data SINGLE LAYER/COMBINATION DIELECTRIC SAMPLE RETURN LOSS SIGNIFICANCE • Results show that material changes at a surface can be predicted and detected • Methodology can be applied to detection of skin surface • phenomena Microwave Spectroscopy in Skin Cancer Detection and Diagnosis
Methodology “Proof-of-Concept” Test Data DIELECTRIC SAMPLE LAYER REMOVAL PROCEDURE • Signal divider “taps off” a portion of the incident signal • Signal combiner adds incident sample to • reflected signal • Partial cancellation possible by varying amplitude and phase of incident signal Microwave Spectroscopy in Skin Cancer Detection and Diagnosis
Methodology “Proof-of-Concept” Test Data DIELECTRIC SAMPLE LAYER REMOVAL PROCEDURE 1.) Measure bottom layer reflection magnitude (single layer directly on absorber layer). 2.) Measure top layer reflection magnitude (single layer directly on absorber layer, bottom layer underneath absorber, to control distances). 3.) Set phase shift and attenuation to cancel top layer response. 4.) Insert bottom layer between absorber and top layer (top layer is still same distance from antenna). 5.) Compare response to that measured in step 1. Microwave Spectroscopy in Skin Cancer Detection and Diagnosis
Methodology “Proof-of-Concept” Test Data TABLE 2 • DIELECTRIC SAMPLE LAYER REMOVAL RESULTS • Top Layer rBottom Layer r / RLRecovered RLAgreement • 2.20 6.15 / 39.1 dB 37.9 dB -1.2 dB • 9.80 6.15 / 39.1 dB 39.5 dB +0.4 dB • 2.20 9.80 / 38.3 dB 37.4 dB -0.9 dB • 6.15 9.80 / 38.3 dB 38.0 dB -0.3 dB Microwave Spectroscopy in Skin Cancer Detection and Diagnosis
Methodology “Proof-of-Concept” Test Data DIELECTRIC SAMPLE LAYER REMOVAL SIGNIFICANCE • Results show that material changes underneath a surface can • be predicted and detected • Methodology can be applied to detection of subcutaneous • phenomena Microwave Spectroscopy in Skin Cancer Detection and Diagnosis
Refinements • Investigate near-field horn antenna characteristics using HFSS simulation software. • Will near-field approximations also coincide with measured reflector response? Microwave Spectroscopy in Skin Cancer Detection and Diagnosis
Refinements • Investigate possible antenna alternatives: • Aperture waveguide antenna: • Gain with respect to horn antenna? • Beamwidth / Field-of-View with respect to horn antenna? • Coaxial probes • Predictable response • Lose non-contact nature of testing • Constant distance - not affected by R2 effects • Fringing effects (non-axial signal spreading) ? Microwave Spectroscopy in Skin Cancer Detection and Diagnosis
Future Direction • Extend “proof-of-concept” to frequencies applicable to biological phenomena • Questions: • What are we going to look for? • Where are we going to look for it? Microwave Spectroscopy in Skin Cancer Detection and Diagnosis
Future Direction Our Idea: O2 Resonance at 60 GHz Why O2? Tumors tend to be angiogenic, increasing blood supply to support metastasis. [10], [11], [12] Altered blood flow implies variable tissue oxygenation levels. [13], [14] http://cancer.gov/cancertopics/understandingcancer Microwave Spectroscopy in Skin Cancer Detection and Diagnosis
Future Direction Our Idea: O2 Resonance at 60 GHz Why 60 GHz? Most pronounced absorption peak. [9], [15] [16] Within capabilities of present-day measurement equipment (e.g., Anritsu 37397C Network Analyzer) http://www.educatorscorner.com Microwave Spectroscopy in Skin Cancer Detection and Diagnosis
Future Direction • Use of biologically-derived skin samples (laboratory mice) • Work with Moffitt Cancer Center and James A. Haley Veterans Hospital (Co-advisement, laboratory use, materials) • Begin construction of skin lesion characteristics database http://health.yahoo.com/centers/skin_cancer/5 Microwave Spectroscopy in Skin Cancer Detection and Diagnosis
Milestones Task Estimated/Completed Date Proof-of-concept experimentation, To be completed Jan. 2006 data collection and analysis Begin oxygenation studies at 60 GHz January 2006 (Non-biological materials) Apply techniques to simulated June 2006 biological samples Acquire third-generation test specimen January 2007 in conjunction with cutaneous Oncology specialists (laboratory mice) Microwave Spectroscopy in Skin Cancer Detection and Diagnosis
Future Work / Further Applications • Establish characteristics database • Benign and malignant tumors of various types for future correlation and identification • Apply technology to characterize burn and wound areas • Other Applications: • Psoriasis studies • Mechanical stress (pressure points, etc.) • Breast Cancer (Ductal carcinoma in-situ microcalcifications) Microwave Spectroscopy in Skin Cancer Detection and Diagnosis
References • [1]Thomas, J. “Skin Cancer – The Facts”, www.skincancerfacts.org.uk, May 2004. • [2] Åberg, P.; Nicander, I.; Holmgren, U.; Geladi, P. and Ollmar, S. “Assessment of Skin Lesions and Skin Cancer using Simple Electrical Impedance Indices”, Skin Research and Technology 2003, vol. 9, pp. 257 – 261. • [3] Dua, R.; Beetner, D.; Stoecker, W. and Wunsch, D. “Detection of Basal Cell • Carcinoma Using Electrical Impedance and Neural Networks”, IEEE • Transactions on Biomedical Engineering, January 2004, pp. 66 - 71. • [4] Mehrübeoğlu, M.; Kehtmavaz, N.; Marquez, G.; Duvic, M. and Wang, L.V. “Skin Lesion Classification Using Oblique-Incidence Diffuse Reflectance Spectroscopic Imaging”, Applied Optics, January 2002, pp. 182 – 192. Microwave Spectroscopy in Skin Cancer Detection and Diagnosis
References • [5] Cui, W.; Ostrander, L.E. and Lee, B.Y. “In Vivo Reflectance of Blood and Tissue as a Function of Light Wavelength”, IEEE Transactions on Biomedical Engineering, June 1990, pp. 632 – 639. • [6] El-Shanawee, M. “Resonant Spectra of Malignant Breast Cancer Tumors Using the Three-Dimensional Electromagnetic Fast Multipole Model”, IEEE Transactions on Biomedical Engineering, January 2004, pp.35 - 44. • [7] Bond, E.J.; Xu, L.; Hagness, S.C.; Van Veen, B.D. “Microwave Imaging via Space-Time Beamforming for Early Detection of Breast Cancer”, IEEE Transactions on Antennas and Propagation, August 2003, pp. 1690 - 1705. • [8] Balanis, C., Advanced Engineering Electromagnetics, New York: John Wiley & Sons, 1989. Microwave Spectroscopy in Skin Cancer Detection and Diagnosis
References • [9] NAWCWPNS TP 8347, Electronic Warfare and Radar Systems Engineering • Handbook (Rev. 2), Washington, DC: Naval Air Systems Command Avionics Department, 1 April 1999. • [10] Freinkel, R.K. and Woodley, D.T., eds., The Biology of the Skin, New York: • Parthenon Publishing Group, 2001. • [11] Kleinsmith, L.J.; Kerrigan, D.; Kelly, J. and Hollen, B. “Understanding Angiogenesis”, National Cancer Institute, • http://cancer.gov/cancertopics/understandingcancer/angiogenesis • [12] Steen, R.G., A Conspiracy of Cells - The Basic Science of Cancer, New York: Plenum Press, 1993. Microwave Spectroscopy in Skin Cancer Detection and Diagnosis
References [13] Pindera, M.Z.; Ding, H. and Lin, P.C. “Development and Validation of Angiogenesis Models”. Huntsville, AL: CFD Research Corporation, 2005. [14] Folkman, J. “Angiogenesis and Its Inhibitors”, DeVita, V.T.Jr.; Hellman, S. And Rosenberg, S.A., eds., Important Advances in Oncology 1985, Philadelphia: J.B. Lippincott Company, 1985. [15] Stimson, G.W., Introduction to Airborne Radar, El Segundo, CA: Hughes Aircraft Company, 1983. [16] Brussard, G. and Watson, P.A., Atmospheric Modeling and Millimetre Wave Propagation, London: Chapman and Hall, 1995. Microwave Spectroscopy in Skin Cancer Detection and Diagnosis
Acknowledgement Support provided by the NSF IGERT grant DGE Grant No., DGE-0221681 Microwave Spectroscopy in Skin Cancer Detection and Diagnosis
And Thanks To... Committee Members Dr. Thomas Weller (Major Advisor) Dr. Jeffrey Harrow (Co-Advisor) Dr. Shekar Bhansali Dr. Lawrence Dunleavy Dr. Noreen Luetteke Dr. Nagarajan Ranganathan Dr. John Whitaker Microwave Spectroscopy in Skin Cancer Detection and Diagnosis
And Thanks Also To... Mr. Bernard Batson Dr. Don Hilbelink Ms. Gayla Montgomery Ms. Norma Paz Emerson & Cuming Microwave Products EZ Form Cable Corporation Rogers Corporation Microwave Spectroscopy in Skin Cancer Detection and Diagnosis
? Microwave Spectroscopy in Skin Cancer Detection and Diagnosis